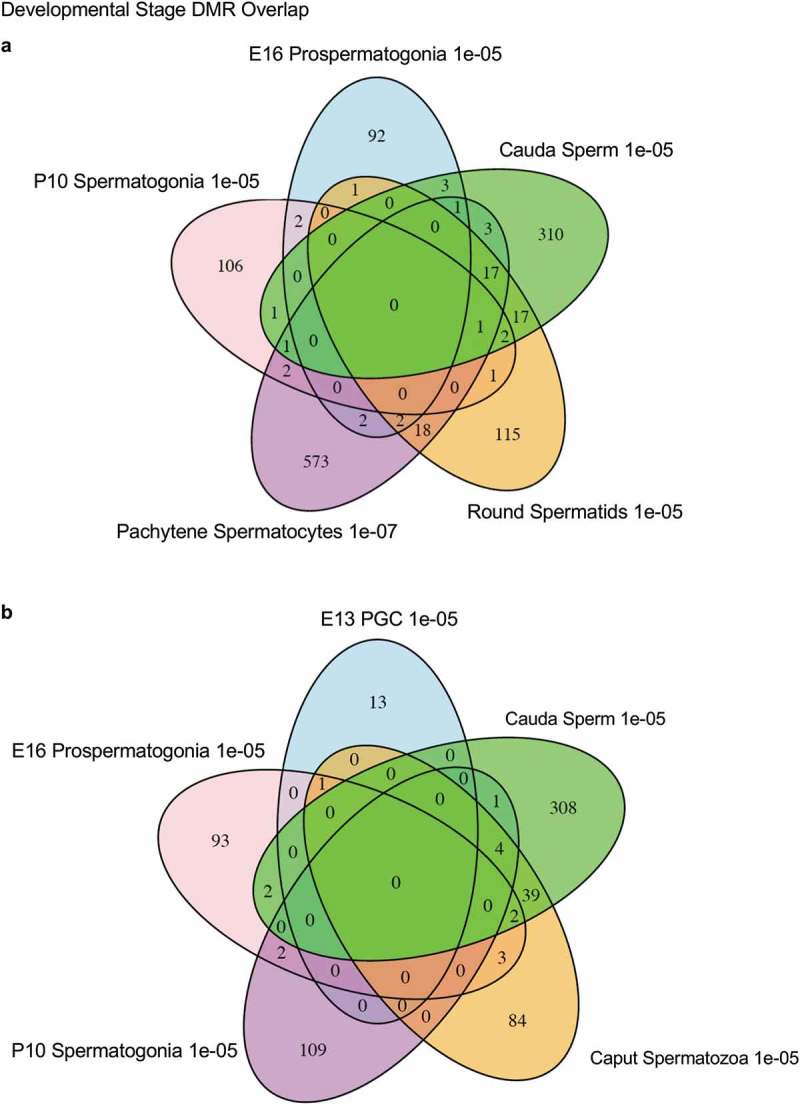
Figure 5.

DMR developmental stage overlaps. The DMRs for the different developmental stages (a) are compared to identify overlapping DMRs in the Venn diagram. (b) The comparison of caput and cauda epididymal sperm DMRs in a Venn diagram with PGCs and spermatogonia.
