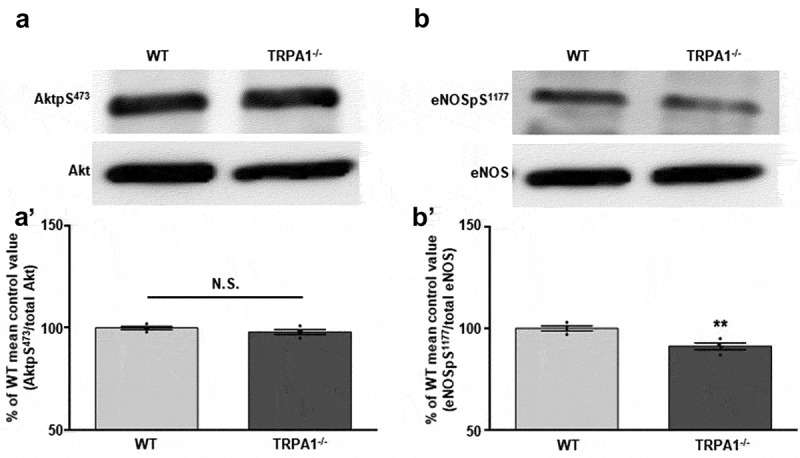
Figure 3.

TRPA1-/- CMs exhibit lower baseline expression levels of eNOSpS1177, but not AktpS473, compared to WT. Representative immunoblots depicting the basal expression levels of (a) AktpS473 and (B) eNOSpS1177 in WT and TRPA1-/- CMs. Total Akt and eNOS were probed as loading controls. (A’) Summarized data for Figure 3(a) and (B’) Figure 3(b). Data are expressed as a percent of the WT control mean value ± SEM. *p < 0.05, **p < 0.01, ***p < 0.001 compared to WT control value.
