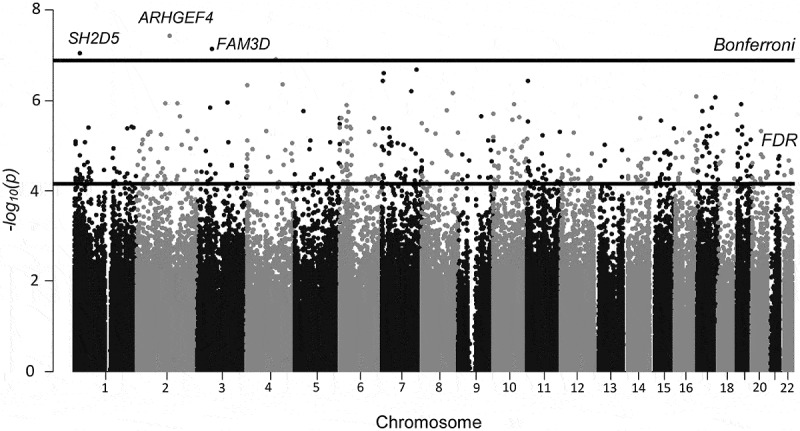
Figure 1.

Manhattan plot depicting differentially methylated CpG sites (by location and – log10 p-value) from the analysis comparing ever vs. never HT-users (n = 90). Five hundred twenty-seven CpGs passed the FDR cutoff (q < 0.05), represented by the lower black line. CpGs from 3 genes (cg01382688 in ARHGEF4, cg26334888 in FAM3D and cg03472655 in SH2D5), on chromosomes 2, 3, and 1 passed a strict Bonferroni correction of p < 1.2x10⁻⁷ (higher black line).
