
Figure 3.
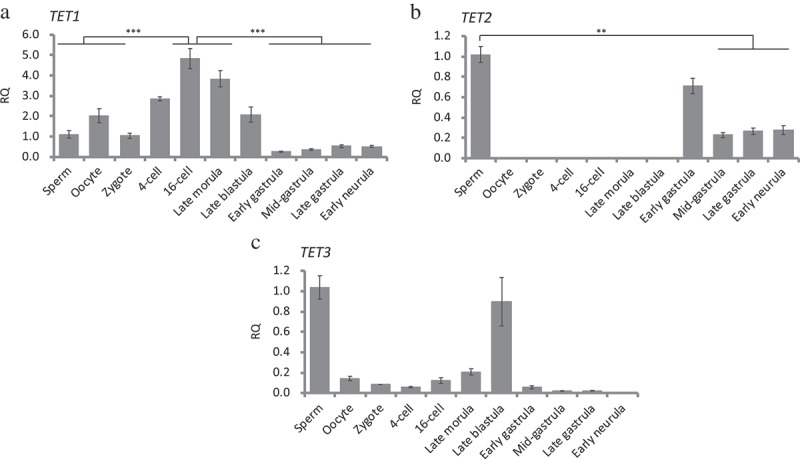
TET methylcytosine dioxygenases expression during early embryonic development measured by real-time qRT-PCR. Gene expressions in all the embryonic stages were normalized against expression in sperm (set as 1). RQ: Relative quantification. (a): TET1, one-way ANOVA analysis showed p < 0.0001, Tukey’s multiple comparisons test showed significant differences between 16-cell, Late morula vs. Sperm, Oocyte, Zygote, blastula stages, gastrula stages, and Early neurula. (b): TET2, one-way ANOVA analysis showed p < 0.0005, Tukey’s multiple comparisons test showed significant differences between Sperm vs. Mid gastrula, Late gastrula, and Early neurula. (c): TET3, one-way ANOVA analysis showed no significant differences among examined stages. TET1, TET2, and TET3 are paternally expressed and TET2 expression began after genome-zygotic transition. TET3 expression was absent after genome-zygotic transition. Data represent mean ± SEM. Asterisk indicates statistical significance (**p < 0.01, ***p < 0.001).