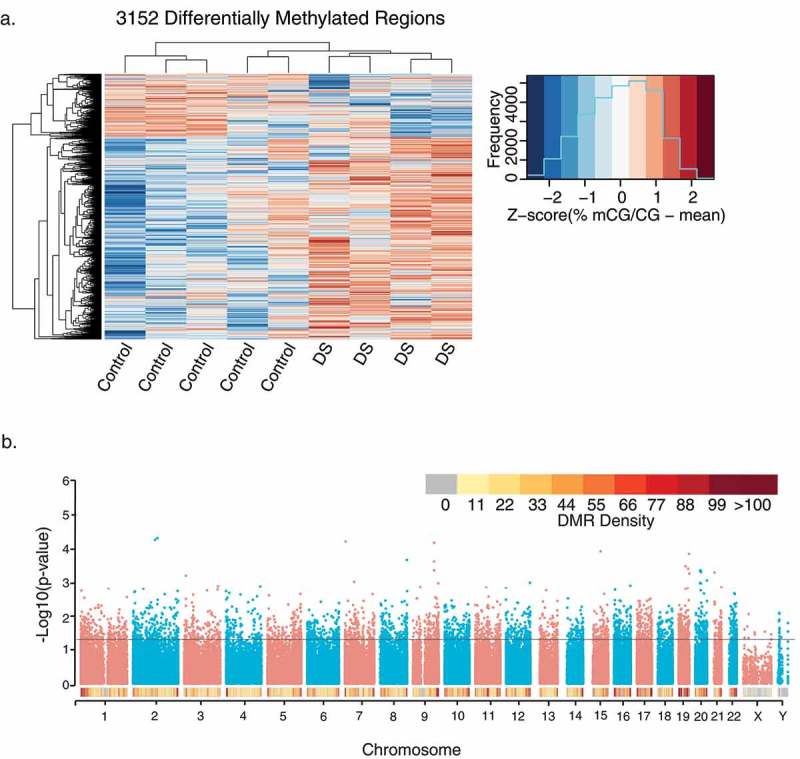
Figure 1.

Profile of 3,152 DS-DMRs identified in post-mortem brain tissue. (a) Heatmap visualization of hierarchical clustering analysis of DMRs. Individual values are presented as Z-scores of the smoothed per cent methylation values to allow for visualization of how many standard deviations each value is from the mean. (b) Genomic coordinate dot plot (Manhattan plot) of DS-DMRs with underlying DMR density plot of 1 Mb bins.
