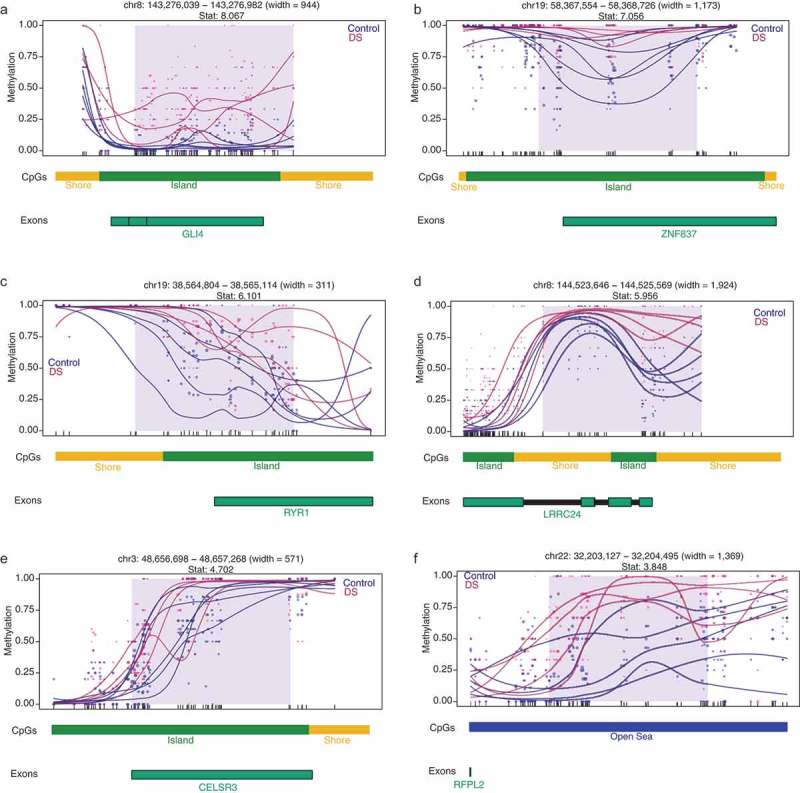
Figure 2.

DMR plots for six select pan-tissue WGBS DS-DMRs. Each dot represents the methylation level of an individual CpG in a single sample, where the size of the dot is representative of coverage. The lines represent smoothed methylation levels for each sample, either control (blue) or DS (red). Genic and CpG annotations are shown below each plot.
