
Figure 4.
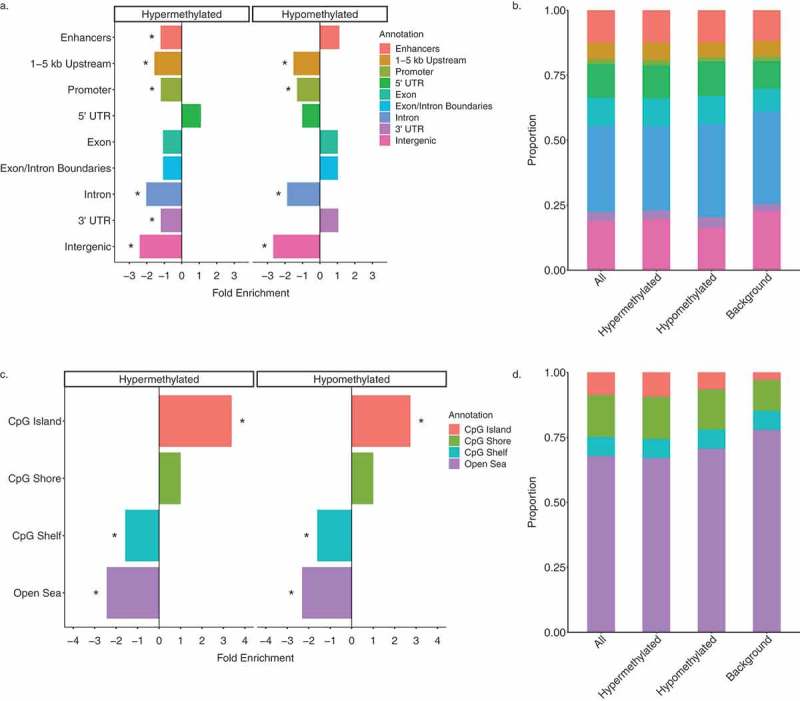
Genomic annotations of DS-DMRs relative to background regions. (a) Enrichment of DS-DMRs in genic annotations. (b) Proportion of DS-DMRs in genic annotations. (c) Enrichment of DS-DMRs in CpG annotations. (d) Proportion of DS-DMRs in CpG annotations. * = q < 0.05 and all the category represents the combination of hypermethylated and hypomethylated DMRs.