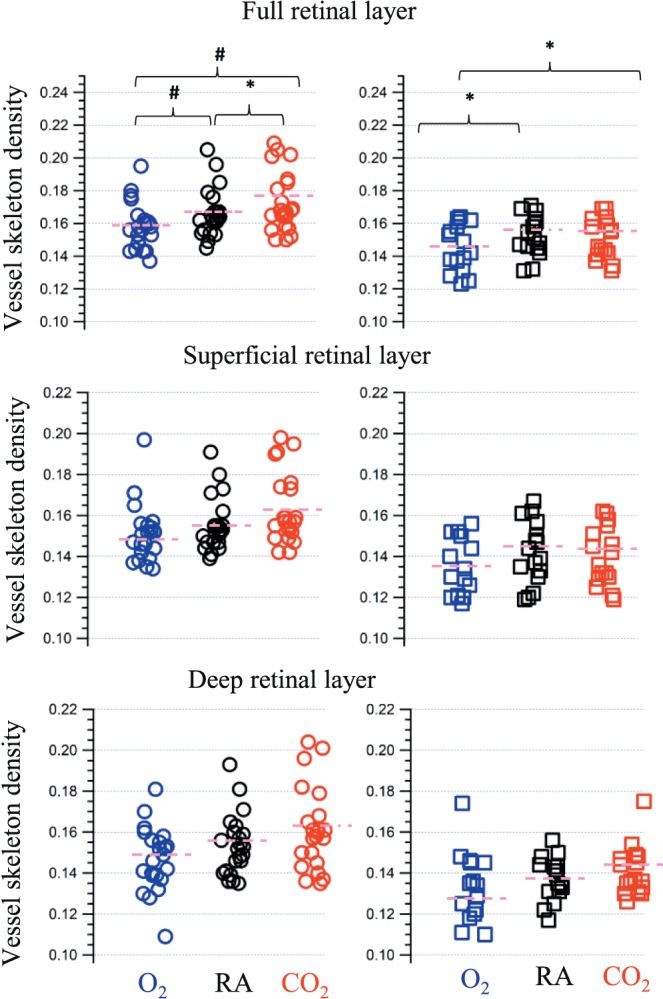
Figure 3.

VSD under three conditions: hyperoxia shown in blue, room air shown in black, and hypercapnia shown in red. The circle and square markers represent controls and patients with DR respectively. The pink short dashes are the mean values of VSD measures. A star and a hash symbol are used to depict post hoc pairwise comparisons between conditions that were significant at P < 0.05 and P < 0.01, respectively.
