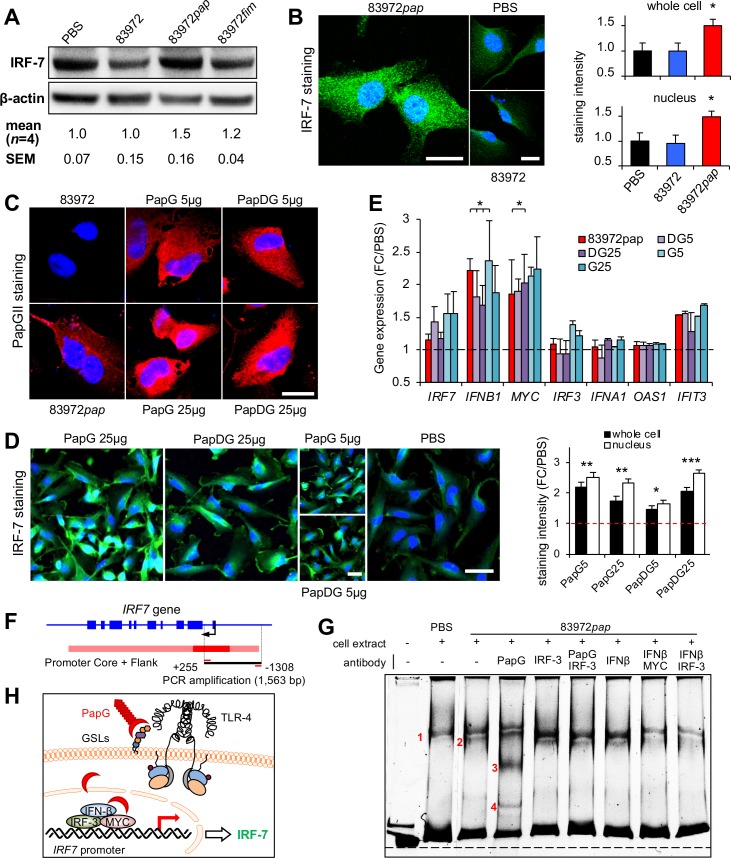
Fig 4. IRF-7 activation by the PapG adhesin.
A. Increase in IRF-7 protein levels after infection of human kidney cells with E. coli 83972pap but not E. coli 83972fim (105 cfu/ml, 4 hours). Western blot analysis. B. Increase in nuclear and total IRF-7 staining, quantified by confocal imaging. Mean + s.e.m. of two experiments, 50 cells/experiment. Two-tailed unpaired t-test compared to PBS. Scale bars = 20 μm. C. PapG internalization after infection or stimulation of cells with purified PapG protein (5–25 μg/ml), quantified by confocal imaging, using polyclonal anti-PapGII antibodies. Scale bar = 20 μm. D. The purified PapG adhesin or the PapDG protein complex stimulated an IRF-7 response, in treated cells (5–25 μg/ml). Scale bars = 50 μm. E. Increase in IRF7, IFNB1, MYC and IFIT3 mRNA levels quantified by qRT-PCR. Cells were infected with E. coli 83972pap or stimulated with the PapG adhesin or the PapDG protein complex (5 or 25 ug/ml). Mean + s.e.m. of two experiments, multiple unpaired t-test compared to PBS. F. IRF7 gene and promoter map. IRF7 promoter DNA (1563bp, -1308 to +255) was used as a probe, in an electrophoretic mobility shift assay (EMSA). G. Extracts from uninfected or E. coli 83972pap infected cells were mixed with the indicated IRF7 promoter fragment. By polyacrylamide gel electrophoresis, one band shift was detected in uninfected cells (band 1) and a second band in E. coli 83972pap infected cells (band 2). Specificity for PapG was supported by two super-shifted bands (bands 3 and 4), in the presence of anti-PapG antibody. Bands 3 and 4 were inhibited by using anti-IRF3 antibody. All bands were attenuated by combining anti-IFNβ with anti-IRF-3 or anti-MYC antibodies. H. Model of IRF7 activation by PapG, including IRF-3, IFNβ and MYC. P < 0.05 (*), P < 0.01 (**), P < 0.001 (***).

