. 2019 May 21;8:e46630. doi: 10.7554/eLife.46630

Figure 4. Biochemical analysis of the ~7 nm complexes formed by SAA and lipolytic products.

SAA-containing complexes, which were obtained upon lipolysis of model (SAA-POPC) or plasma lipoproteins (HDL and LDL) by sPLA2, were isolated at 1.17–1.20 g/mL density (Figure 4—figure supplement 1). These isolated complexes, marked SAA + hydHDL (A), SAA + hydLDL (B) or SAA + sPLA2-hydrolyzed HDL, LDL or POPC (E), were analyzed for protein (A–D) and lipid composition (E). SDS PAGE (A) and matrix-assisted laser desorption ionization – time of flight mass spectrometry (B) of SAA + hydHDL revealed SAA and apoA-I; the protein mass detected by mass spectrometry was 11,606 Da for SAA and 28,086 for apoA-I (B). Similar analyses of SAA + hydLDL complexes showed only SAA (C, D). (E) Thin-layer chromatography showed the presence of PC and lysoPC in the SAA-containing ~7 nm complexes that were obtained from all hydrolyzed lipoproteins (HDL, LDL) or model lipids (POPC). Lipid-free SAA and the 1.17–1.20 g/mL density fraction isolated from SAA mixtures with non-hydrolyzed HDL or LDL (SAA + HDL in panel (A) and SAA + LDL in (C)) are shown for comparison.

Figure 4.

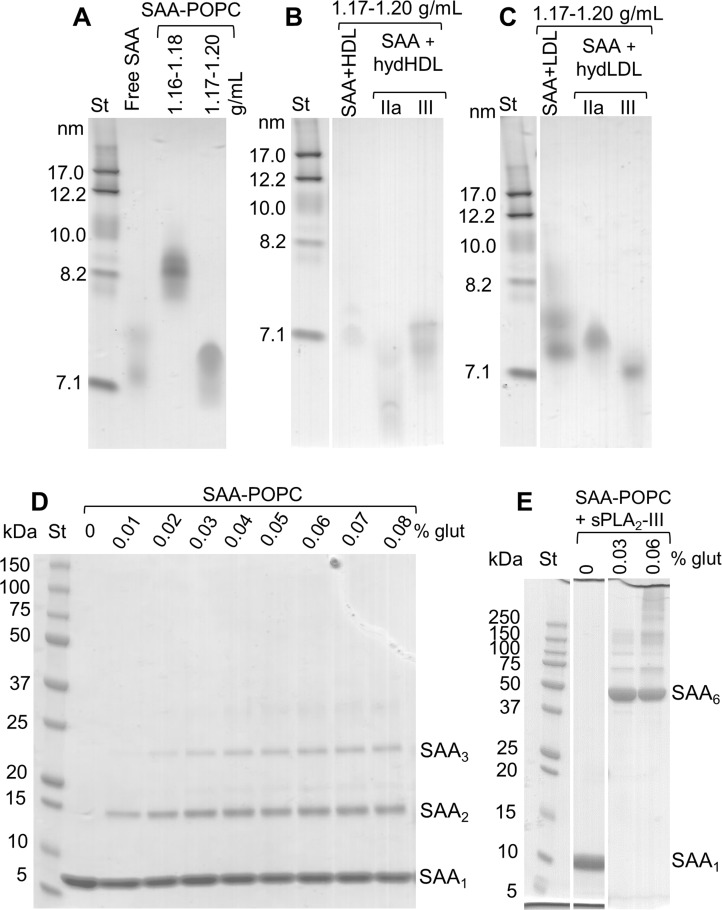
Figure 4—figure supplement 1. Gel electrophoresis of isolated SAA complexes with the products of phospholipid hydrolysis.

Figure 4—figure supplement 1.

All gels were stained with Denville Blue protein stain. (A) Non-denaturing PAGE of model SAA-POPC complexes, which were prepared as described in 'Materials and methods' using 1:10 SAA:POPC mol:mol and hydrolyzed by sPLA2-III. The intact complexes were isolated in the density range 1.16–1.18 g/mL, and the hydrolyzed complexes in the density range 1.17–1.20 g/mL (as indicated on the lanes). Lipid-free SAA is shown for comparison. Non-denaturing PAGE of (B) HDL and (C) LDL from human plasma that were hydrolyzed by sPLA2-III or sPLA2-IIa (as indicated) and incubated with SAA to form 7–7.5 nm complexes (as described in the Figure 3 legend). These complexes were isolated by density gradient centrifugation in the density range 1.17–1.20 g/mL (as indicated on the lanes). Similar density fractions isolated from SAA mixtures with intact HDL or LDL (labeled SAA + HDL in panel (B) and SAA + LDL in panel (C)) are shown for comparison. SDS PAGE of model SAA-POPC complexes that were either (D) intact or (E) hydrolyzed by sPLA2-III. The complexes (containing 0.5 mg/ml protein in 50 mM PBS at pH 7.5) have been cross-linked with glutaraldehyde (as described in 'Materials and methods); the cross-linker concentrations are indicated. Gel bands corresponding to SAA monomers and oligomers are indicated.