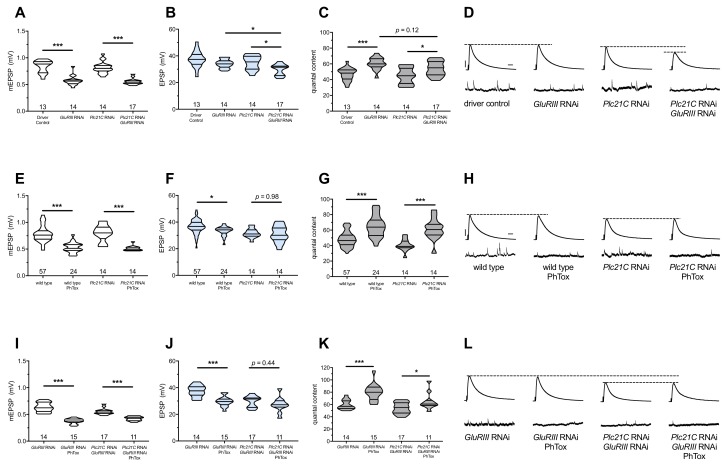
Figure 1. Maintenance of presynaptic homeostatic potentiation requires PLCβ, but induction does not.
(A) GluRIII knockdown induces a significant decrease in quantal size for both driver control and Plc21C knockdown genetic backgrounds. (B) EPSP amplitudes are maintained with GluRIII knockdown alone but dampened with concurrent GluRIII and Plc21C knockdown. (C) There is significant PHP (Presynaptic Homeostatic Potentiation, measured as an increase in quantal content) in response to GluRIII knockdown. (D) Representative electrophysiological traces of EPSPs (above) and mEPSPs (below). The evoked events show full PHP in the GluRIII RNAi knock down background and partial PHP with concurrent Plc21C knock down. (E) 10-min incubation with 20 μM PhTox diminishes quantal size for all conditions. (F) EPSP amplitudes after acute PhTox incubation are maintained at or near normal levels. (G) The data in (F) are because PHP is rapidly induced in wild-type and Plc21C RNAi NMJs after PhTox incubation. (H) Representative electrophysiological traces show fully intact PHP induction. (I) With dual PHP maintenance (GluRIII knockdown) and induction (PhTox application), quantal size is further decreased. (J) EPSP amplitudes after dual maintenance and induction. (K) Quantal is content further increased in by PhTox treatment in GluRIII RNAi synapses compared to untreated synapses; this expression of PHP does not require full PLCβ function. (L) Representative electrophysiological traces illustrate that even though PHP maintenance is impaired with PLCβ knockdown, PHP induction is not impaired. Violin plots have horizontal lines signifying the 0th, 25th, 50th, 75th, and 100th percentiles of the data distribution; the distribution itself is delineated by the shapes of the plots. *p<0.05, **p<0.01, ***p<0.001 by Student’s T-Test versus non-challenged genetic control or by one-way ANOVA with a Bonferroni post-hoc test in the case of comparing degree of compensation with GluRIII RNAi and Plc21C RNAi + GluRIII RNAi. Scale bars for all traces are y = 10 mV (1 mV), x = 20 ms (500 ms) for EPSPs (mEPSPs).

