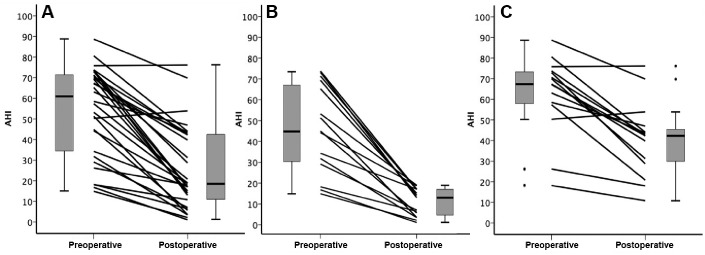
Figure 1. Preoperative and postoperative AHI.
The distribution of group AHI values are shown in the box-and-whiskers plots (group median, upper and lower quartile, upper and lower extreme, and outliers). (A) Preoperative and postoperative AHI in the whole group. (B) Individual preoperative and postoperative AHI in responders (n = 15). (C) Preoperative and postoperative AHI in nonresponders (n = 15). AHI = apnea-hypopnea index.

