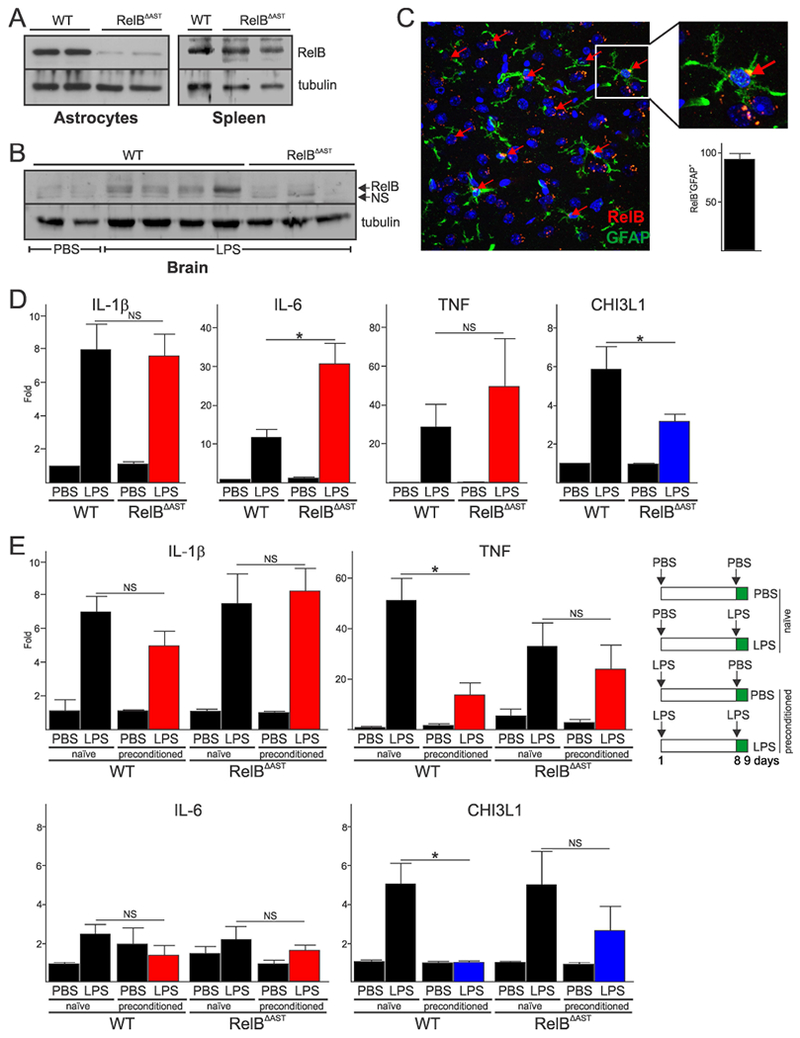
Fig. 6. Astrocytic RelB regulates neuroinflammation and tolerance in vivo.

(A) Analysis of RelB expression in astrocytes of WT and RelBΔAST mice. (B) Analysis of RelB protein expression in the brains 24h post intraperitoneal injection of PBS or 5 mg/kg LPS. (A-B) Representative blots of two experiments are shown. (C) RelB protein was visualized by IF in the cortex of WT mice 24h post intraperitoneal injection of 5 mg/kg LPS. Anti-GFAP antibody was used to co-stain astrocytes, and Hoescht to visualize nuclei. Quantification of RelB+GFAP+ cells as a percentage of all GFAP+ cells is shown in lower panel (n=7). (D) Expression of mRNAs in the brains of mice receiving PBS or 5 mg/kg LPS (n=6, 11, 6, 12, respectively). (E) Expression of mRNAs in the brains of mice receiving two doses of 2 mg/kg LPS one week apart (right panel). qPCR analysis of mRNA from two independent experiment (n=4, 7, 3, 8, 3, 6, 3, 7, respectively). Error bars represent s.e.m., * P<0.05 (two-way ANOVA, Sidak’s test).
