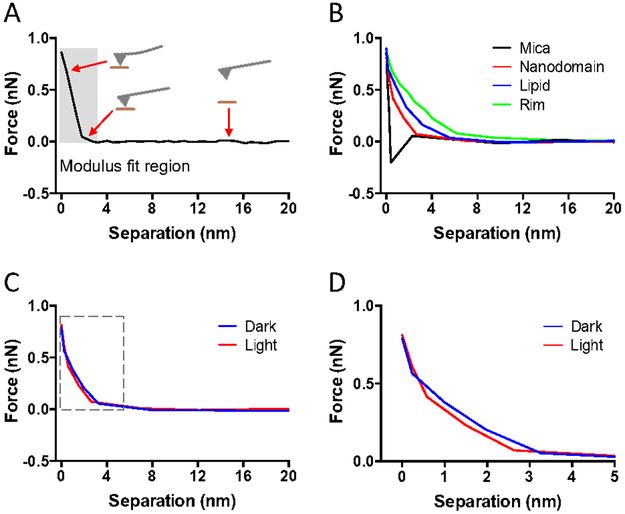
Figure 1.
A sample of FD curves collected in FD-AFM experiments on ROS disc membranes. FD curves shown were adjusted for the cantilever deflection so that the distance represents the tip-sample separation. A. Example of an approach FD curve. The approach curve records the force applied as the AFM probe approaches and then presses into the sample surface. The position of the AFM probe in relation to the sample surface is illustrated at different points of the approach curve. The Young’s modulus is computed by fitting the curve in the region highlighted by the shaded box. B. Sample of approach FD curves obtained from mica (black), rhodopsin nanodomains (red), lipid bilayer (blue), and the rim region of the ROS disc (green). C. Sample of approach FD curves obtained from rhodopsin nanodomains in the dark (blue) or after photobleaching (red). The region of the curve highlighted by the box is presented in panel D. D. Zoomed in view of the FD curve in panel C that includes the region used to fit the data to compute the Young’s modulus.

