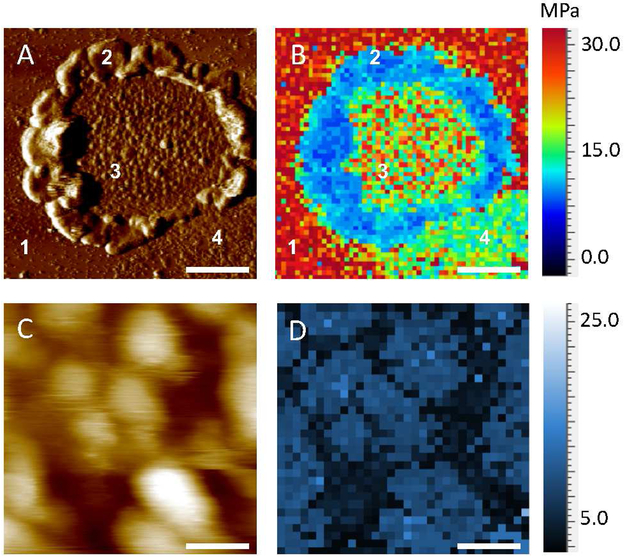
Figure 2.
FD-AFM of a ROS disc membrane. A. A deflection AFM image of a ROS disc membrane is shown. The mica surface (1), rim region (2), lamellar region with rhodopsin nanodomains (3), and empty lipid bilayer (4) are noted. Scale bar, 500 nm. B. The Young’s modulus was determined in each pixel of the image and mapped onto the image of the ROS disc membrane shown in panel A. The Young’s modulus map consists of 64×64 pixels. C. A zoomed in height AFM image of rhodopsin nanodomains and lipid bilayer present in the lamellar region of the ROS disc. Scale bar, 100 nm. D. Mapping of the Young’s modulus in the lamellar region of the ROS disc membrane shown in panel C. The Young’s modulus map consists of 32×32 pixels.

