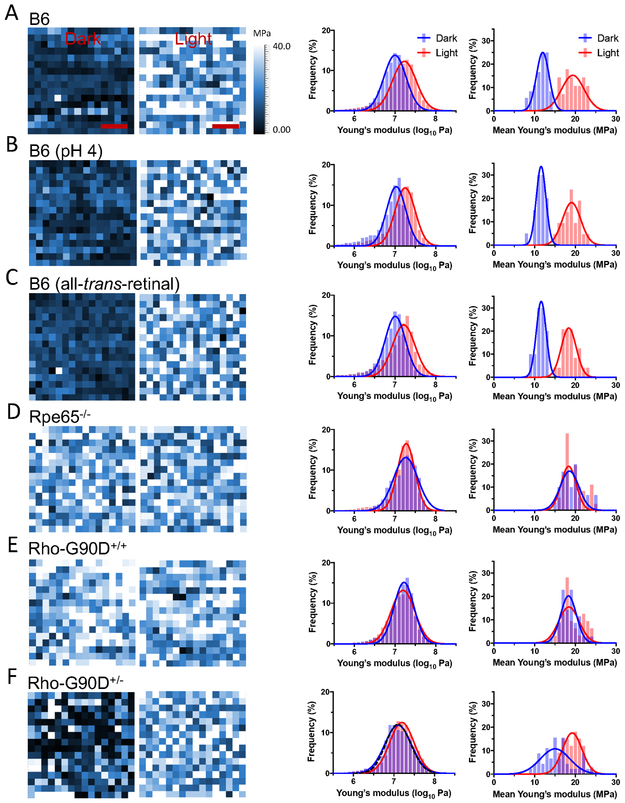
Figure 3.
Young’s modulus of rhodopsin nanodomains in the dark state and after photobleaching. Representative Young’s modulus maps of a single rhodopsin nanodomain is shown in the first set of images. The Young’s modulus was determined for each pixel in a 20×20 nm2 area (16×16 pixels) of a rhodopsin nanodomain in ROS disc membranes from B6 mice (A), B6 mice at acidic pH (B), B6 mice in the presence of all-trans-retinal (C), Rpe65−/− mice (D), homozygous G90D rhodopsin (Rho-G90D+/+) mice (E), or heterozygous G90D rhodopsin (Rho-G90D+/−) mice (F). The Young’s modulus maps are of rhodopsin nanodomains investigated under dark conditions (left map) or after photobleaching (right map). Scale bar, 5 nm. Histograms were generated from Young’s modulus map data obtained under dark conditions (blue) or after photobleaching (red). The histograms on the left-hand side are those of individual Young’s modulus values determined from each pixel in all Young’s modulus maps generated. The number of pixels analyzed under dark and light conditions are as follows: B6, 7420 and 6134; B6 (pH 4), 5371 and 5620; B6 (all-trans-retinal), 5317 and 5617; Rpe65−/−, 5364 and 5565; Rho-G90D+/+, 5888 and 5184; Rho-G90D+/− 12259 and 5374. The black dashed line in the histogram for heterozygous G90D rhodopsin mice (F) represents a simulated double Gaussian curve generated using parameters from the Gaussian function fit of histograms for B6 mice under dark and light conditions (A). Mean Young’s modulus values were also computed for each individual map and histograms generated. The histograms on the right-hand side are those of mean Young’s modulus values in individual Young’s modulus maps. Histograms of mean Young’s modulus values on the right-hand side are presented in addition to histograms of individual Young’s modulus values on the left-hand side since they better illustrate the difference in Young’s modulus exhibited by inactive and active rhodopsin. The number of maps analyzed under dark and light conditions are as follows: B6, 36 and 28; B6 (pH 4), 20 and 21; B6 (all-trans-retinal), 20 and 24; Rpe65−/−, 30 and 36; Rho-G90D+/+, 35 and 32; Rho-G90D+/−, 45 and 33, respectively. All histograms were fit with a Gaussian function and the fitted parameters are reported in Tables S4 and S5.

