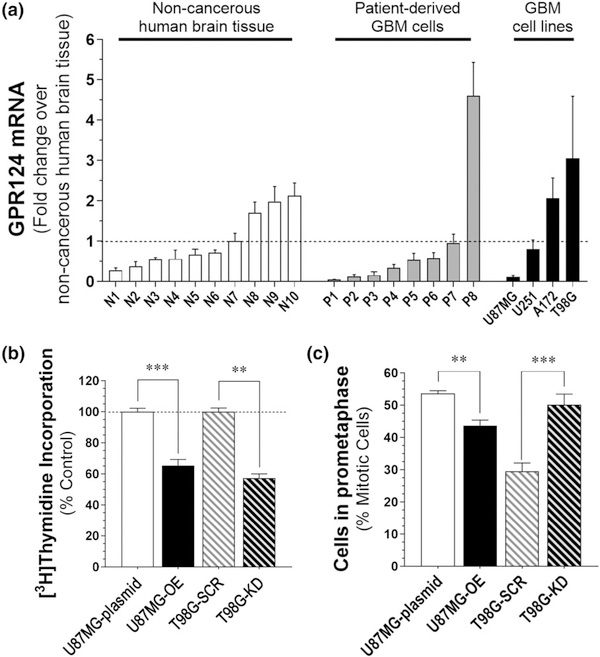
FIGURE 1.
Glioblastoma cells express low and high levels of GPR124, and changes in its expression differentially regulate cell proliferation and mitotic progression. (a) GPR124 mRNA (ADGRA2) expression measured by qPCR in noncancerous human brain tissue, patient-derived glioblastoma spheres and glioblastoma cell lines. Specifics about human samples are in Table S1. Data are the mean ± SEM of three experiments expressed as a fold-change over the average ADGRA2 expression in all noncancerous brain tissues. (b) Cell proliferation measured by [3H] thymidine incorporation in U87MG cells expressing a control pcDNA vector (U87MG-plasmid) compared with U87MG cells with increased GPR124 expression (U87MG-OE), and of T98G cells expressing a scrambled shRNA control (T98G-SCR) compared with T98G cells with reduced GPR124 expression (T98G-KD). Data are the mean ± SEM of at least three experiments. ***p < .001, **p < .01, Student’s t-test compared to corresponding control. (c) Proportion of cell in prometaphase determined by fluorescent microscopy for U87MG-plasmid cells compared with U87MG-OE, and of T98G-CTR cells compared with T98G-KD cells. Data are mean ± SEM of at least three experiments. **p < .01 compared with corresponding control, Student’s t-test

