
Fig. 4.
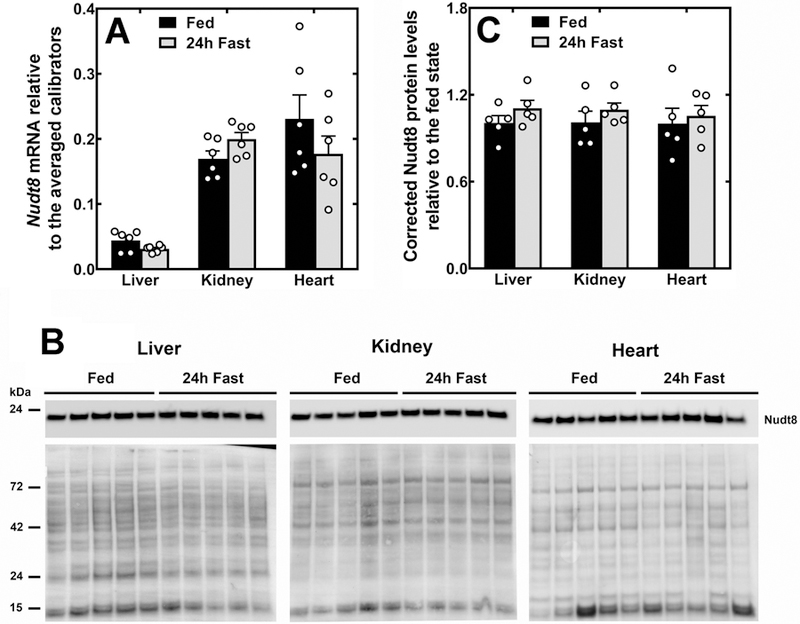
Nudt8 expression in the liver, kidneys and heart of fed and fasted mice. (A) Nudt8 mRNA in the liver, kidneys and heart of mice fed ad libitum or fasted for 24 h. (B) Western blot analysis showing that Nudt8 protein levels do not change with the nutritional state. Total protein loading is shown under each immunoblot. (C) Quantification of the western blots in (B) normalizing to total protein loading and expressing the corrected intensity relative to the fed state. Data in (A) and (C) are shown as the mean (bars) of measurements on individual mice (circles) ± SEM.