Fig. 5.
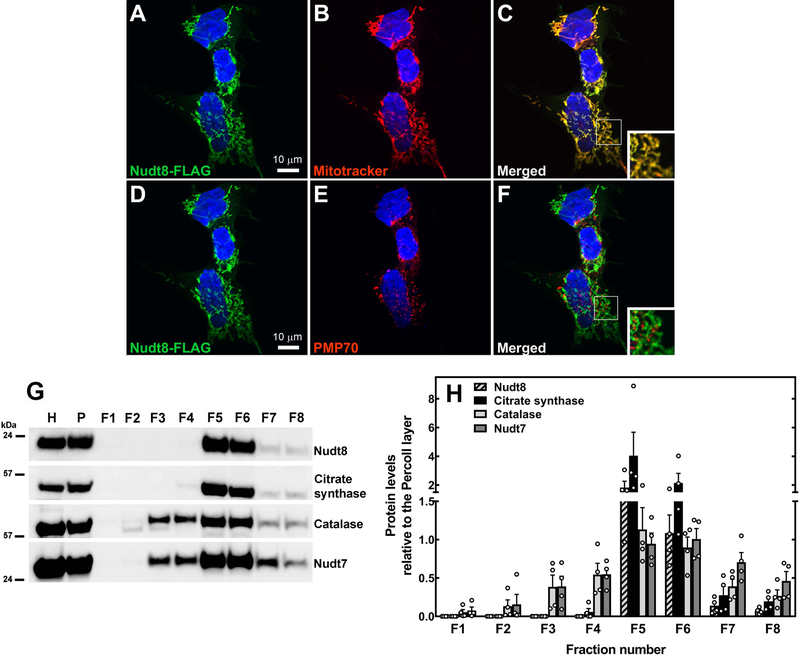
Mitochondrial localization of Nudt8. HEK293 cells were transfected with plasmids encoding Nudt8 with a C-terminal FLAG tag, fixed, and analyzed by confocal microscopy. (A, C, D, F) Nudt8, visualized with the FLAG antibody, is in green. (B-C) Mitochondria, visualized using Mitotracker Orange CMTMRos, are in red. (E-F) Endogenous PMP70, used as a peroxisomal marker, is in red. Cell nuclei were stained with DAPI, in blue. Insets in merged images show details at higher magnification. The results are representative of at least two independent experiments. (G-H) Subcellular fractionation of mouse livers. Nudt8 exhibited a sedimentation profile similar to the mitochondrial marker citrate synthase. Catalase and Nudt7 were used as peroxisomal markers. The results are representative of four independent experiments quantified in (H) relative to the input in the Percoll layer, P. H, liver homogenate; F1–8, fractions 1–8.AUTHOR: Figure captions are extracted from the PDF source file. Please check if this is okay

