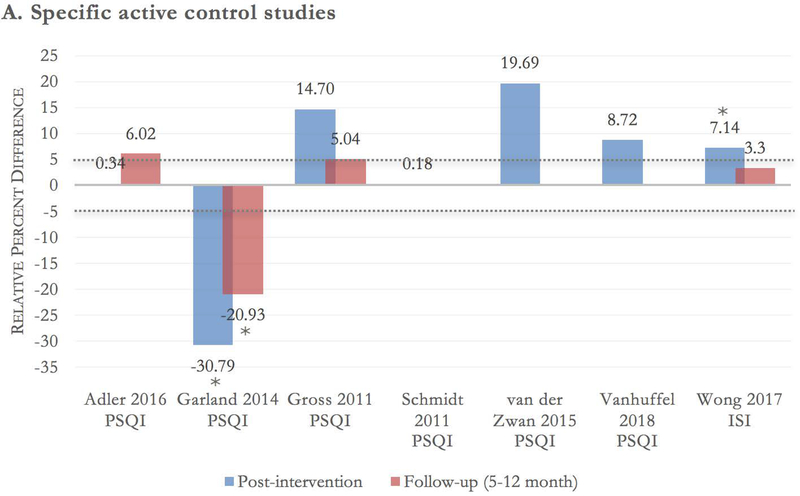
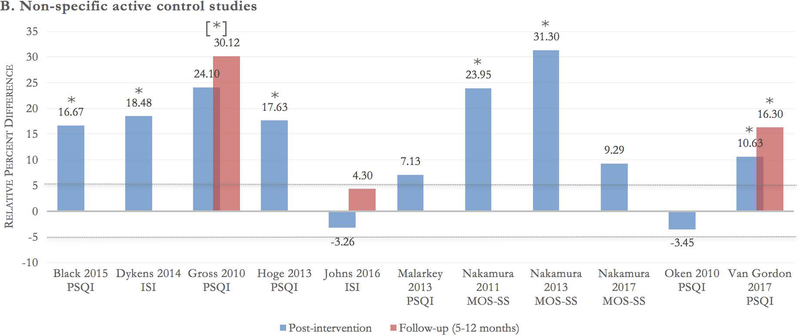
Figure 2.
A-B Between-group relative percent difference in change score. Author, year, and sleep scale are noted at the bottom of each cluster bar. Follow-up scores are reported for trials with a follow-up assessment between 5 and 12 months from baseline. Percent change in sleep score was calculated using the formula: {[(postintervention mean^control – baseline mean^control) – (postintervention mean^meditation – baseline mean^meditation)] / (baseline mean^meditation)} × 100. Positive scores should be interpreted as relative percent change in favor of meditation. For example, a change score of 20% indicates the meditation group had a 20% higher improvement in sleep quality score compared with the control group. Dotted lines at −5% and 5% demarcate the effect threshold and do not indicate statistical significance. *The result is statistically significant per manuscript. [*] overall group effect is statistically significant; the effect for individual time points was not reported.


