
Figure 10.
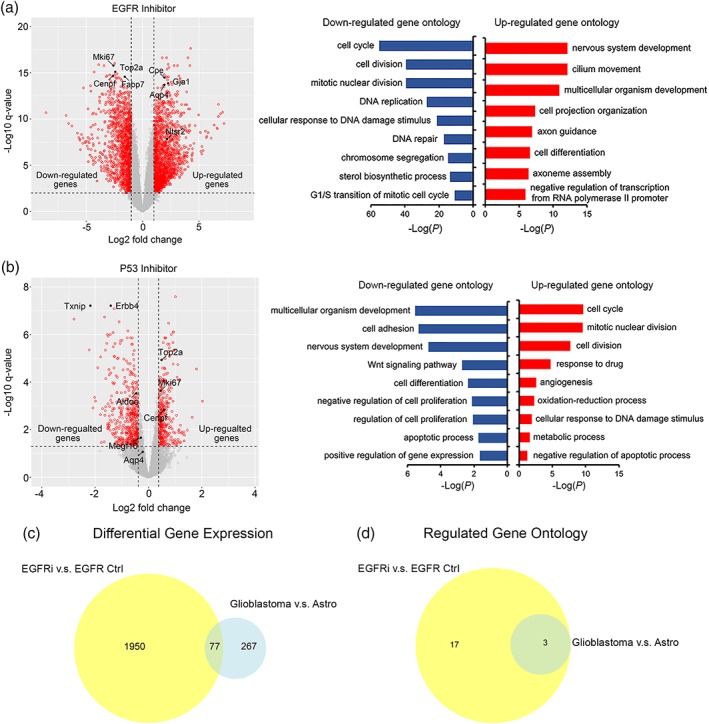
Genes differentially expressed by astrocytes with EGFR inhibition and P53 inhibition. (a,b) Volcano plots showing differentially expressed gene with EGFR and P53 inhibition. Gene ontology terms enriched in genes up‐ and down‐regulated with EGFR and P53 inhibition. (c) Comparison of differentially expressed genes by EGFR inhibition, P53 inhibition, and glioblastoma. (d) Comparison of gene ontology terms differentially affected by EGFR inhibition, P53 inhibition, and glioblastoma [Color figure can be viewed at wileyonlinelibrary.com]