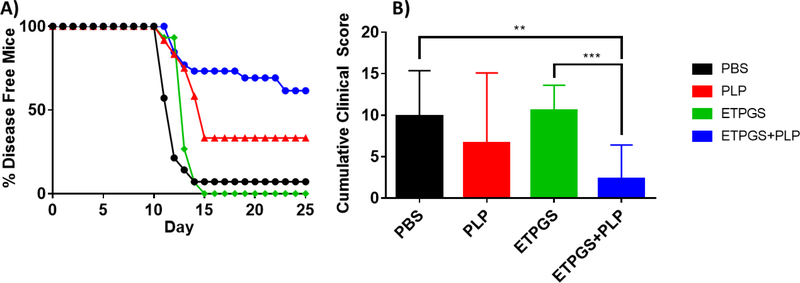
Fig. 4.
Clinical scoring data were analyzed by A.) disease onset by group, as determined by proportion of mice having exhibited any clinical score by the day of each time point, and B.) area under the scoring curve for each treatment group. (n = 12–15 mice/group, *p < 0.05, **p < 0.01, ***p < 0.001). Error bars are reported as standard deviation among samples.

