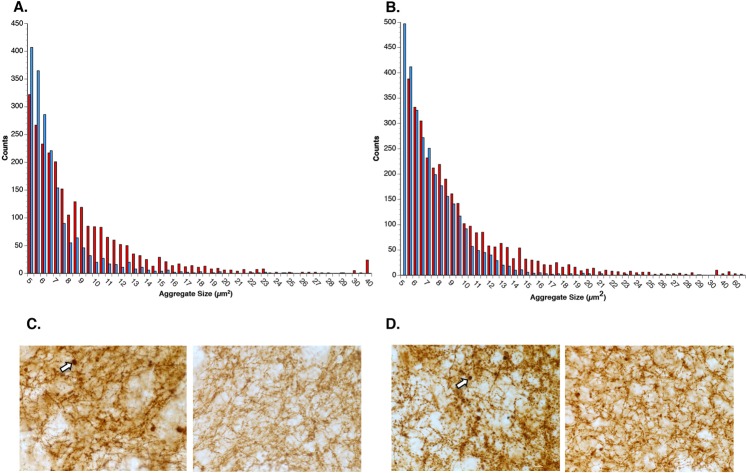
Figure 6.
GM1 treatment reduces the size of α-synuclein-positive aggregates in the striatum. (A) The size distributions of striatal α-synuclein-positive aggregates in saline-treated (N = 6) (red bars) compared to early start GM1-treated (blue bars) animals (N = 6) were significantly different (Kolmogorov-Smirnov D = 0.2945, P < 0.0001), with a clear shift to larger numbers of smaller sized aggregates and fewer larger sized aggregates in the early GM1 group compared to the saline-treated group. (B) The size distributions of striatal α-synuclein-positive aggregates in the delayed GM1-treated group (N = 8) (blue bars) was also significantly different (Kolmogorov-Smirnov D = 0.154, P < 0.0001) than size distribution of aggregates in the saline-treated group (N = 7) (red bars), with greater numbers of larger sized aggregates in the saline-treated group compared to the GM1 group. (C) Photomicrographs of α-synuclein immunohistochemical staining in the striatum of saline-treated (left) and early start GM1-treated (right) animals. Sizes of aggregates are notably smaller in the GM1-treated animal. Arrow points to large α-synuclein-positive aggregate. (D) Photomicrographs of α-synuclein immunohistochemical staining in the striatum of saline-treated (left) and delayed start GM1-treated (right) animals. Sizes of aggregates are smaller in the delayed start GM1-treated animal, but the effect was not as dramatic as in the early-start GM1 animals. Arrow points to large α-synuclein-positive aggregate.

