Figure 2.

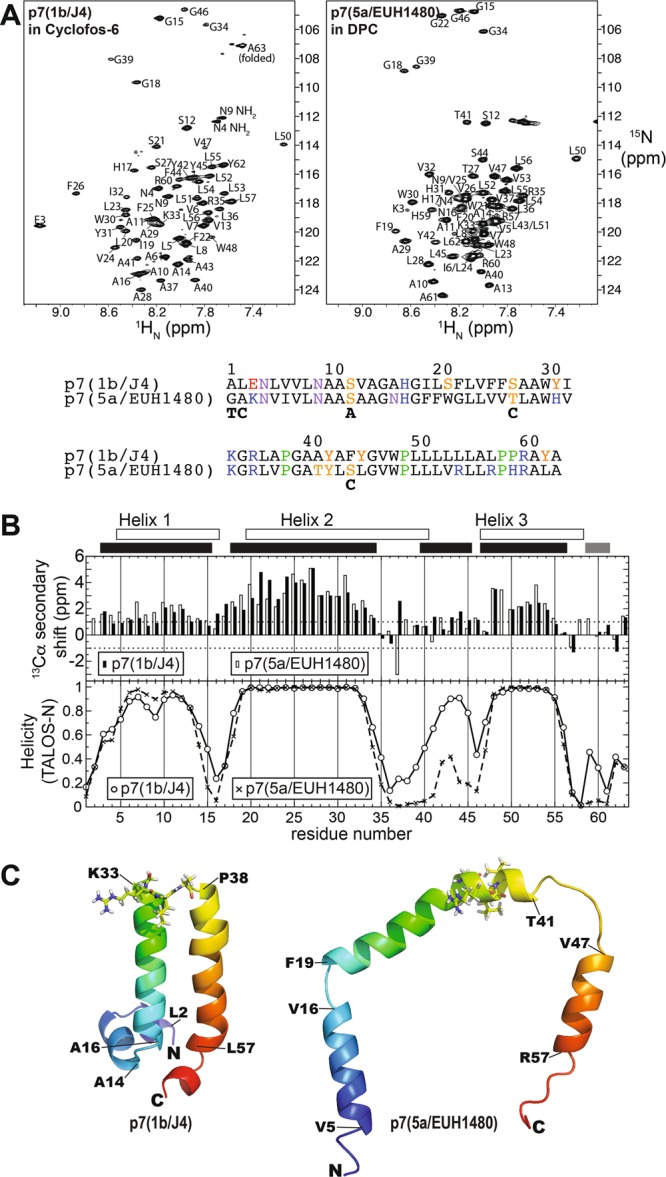
Spectral characterization of HCV p7 isolates. (A) 2D 1H-15N HSQC spectra of p7(1b/J4) in Cyclofos-6 (left), and p7(5a/EUH1480) in DPC (right), with amino acid assignments indicated. The amino acid assignments of the p7(5a/EUH1480) spectrum were transferred from29. The amino acid sequences of the constructs are shown below the spectra. Below the sequence for p7(5a/EUH1480) are indicated the native amino acids that were substituted in this construct used for experiments here and in29. (B) Top: 13Cα secondary chemical shift index for p7(1b/J4) (filled bars) and p7(5a/EUH1480) (open bars), with positive values indicative of α-helical conformation. Bottom: TALOS-N46 chemical shift-based secondary structure prediction for p7(1b/J4)(⚪) and p7(5a/EUH1480) (X). Chemical shift data for p7(5a/EUH1480) were taken from the BioMagResBank entry 1916229. Shown above the plot and indicated by unfilled and filled bars are the helical residues determined for p7(5a/EUH1480) from PDB 2M6X and those predicted from chemical shifts for p7(1b/J4), respectively. (C) Left: Membrane CS-Rosetta-based structure of p7(1b/J4). Right: A single subunit of p7(5a/EUH1480) showing the horseshoe-like conformation in the oligomeric model 2M6X29 is shown for comparison. The structures are shaded from blue (N-terminus) to red (C-terminus) and the residues 34–37 are shown as sticks. The residues at the beginning and end of each helix are indicated.
