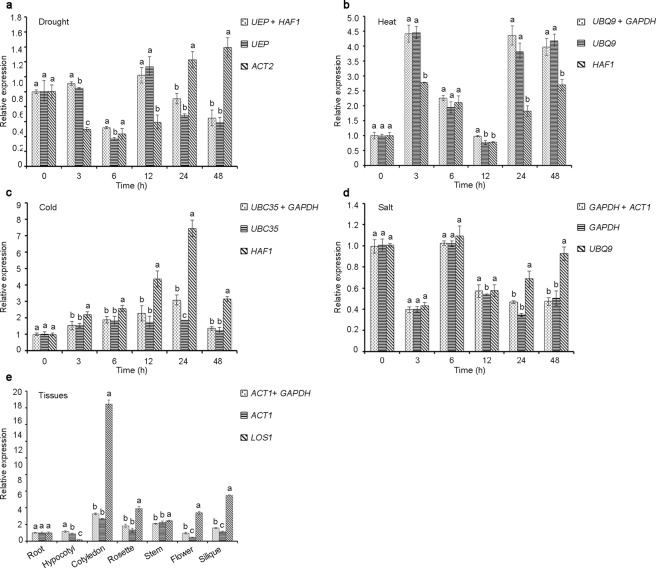
Figure 4.
Relative expression levels of KUP9 across all experimental sets normalized by the most stable reference gene combination, the most stable gene and the most unstable gene. (a) Drought stress. (b) Heat stress. (c) Cold stress (d) Salt stress. (e) Tissues. Error bars represent the standard deviation of three biological replicates. Different lowercase letters represent statistically significant differences as determined by one-way ANOVA (P < 0.05, Duncan’s multiple range tests).

