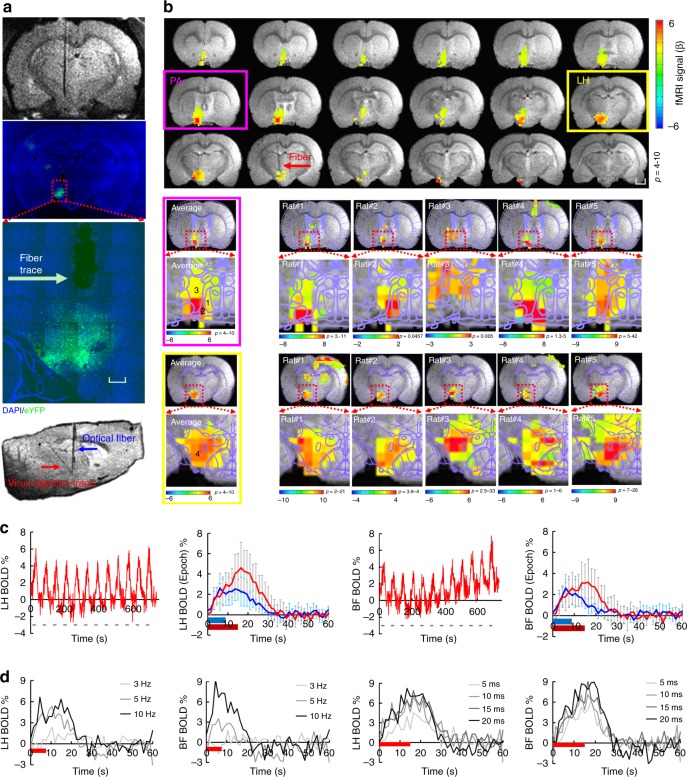
Fig. 3.
MgRA-driven fiber optic targeting of the lateral hypothalamic nuclei with optogenetic fMRI. a Top: representative RARE anatomical image used to clarify the optical fiber location driven by MgRA for optical stimulation in LH. Middle: representative wide-field fluorescence image illustrating robust ChR2-eYFP expression focused on LH. Fiber optic insertion trace marked with white arrow. Scale bar, 200 µm. Bottom: sagittal RARE anatomical image showing the fiber optic trace (blue arrow) and virus injection trace (red arrow). b Top: average fMRI map of brain-wide activity during optogenetic stimulation of LH neurons at 5 Hz, 20 ms pulse width, 15 s duration. Middle: averaged evoked BOLD map (left) and the same map from 5 individual rats (right) zoomed in on the basal forebrain (BF) showing activation of the lateral preoptic nucleus (LPO) and medial preoptic area (MPA), overlaid with the brain atlas. Bottom: average evoked BOLD map (left) and 5 individual rats (right) in lateral hypothalamic region, overlaid with the brain atlas. GLM-based t-statistics in AFNI is used. Scale bar, 2 mm. c Average time courses of significantly modulated voxels showing fMRI signal changes within the ipsilateral LH and BF (n = 5 animals) upon optogenetic stimulation of block design: 15 s on/45 s off, 12 epoch, 20 ms light pulse, 5 Hz, 18.9 mW. The individual hemodynamic response shows the average BOLD signal upon different stimulation durations (8 s in blue, 15 s in red). Error bars represent mean ± SD across 5 animals. d Average stimulation duration-locked time evolution for both LH and BF depicting the frequency-dependent hemodynamic responses at 3, 5, and 10 Hz with 8 s stimulus duration, as well as pulse-width-dependent hemodynamic responses at 5, 10, 15, and 20 ms with 15 s stimulus duration, from one representative rat

