Fig. 5.
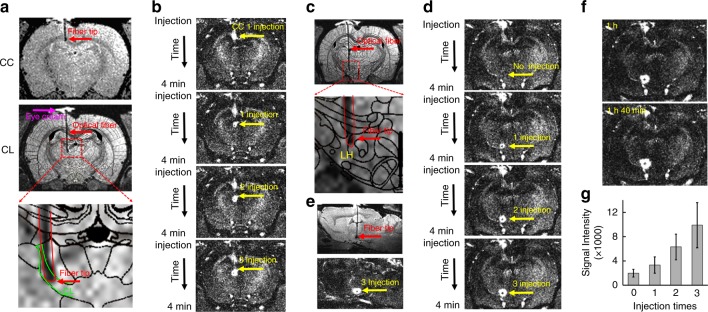
MgRA-driven Mn-injection into CL and LH. a Top: the representative RARE anatomical image used to clarify the optical fiber location driven by MgRA for Mn injection in CC. Middle: the atlas overlapped RARE images to illustrate the fiber tip location at the CL. Eye cream is covering the craniotomy (magenta arrow). Bottom: enlarged image of fiber location. b T1-weighted MPRAGE image (Mdeft) showing enhanced signal from Mn injection site in the CC and CL with dose-dependency. c Top: the atlas overlapped RARE images to illustrate the fiber tip location at the LH, Bottom: enlarged image of fiber location. d T1-weighted MPRAGE image showing enhanced signal from Mn injection site in the LH with dose-dependency. e Sagittal view of RARE anatomical image and MPRAGE image after MnCl2 solution injection. f T1-weighted MPRAGE image at 1 h and 1 h 40 min after the injection. g The analysis of MEMRI signal at no injection, 1 injection, 2 injection, and 3 injection times, as shown in (b, d) (n = 5 injection points from 3 animals). Error bars represent mean ± SD

