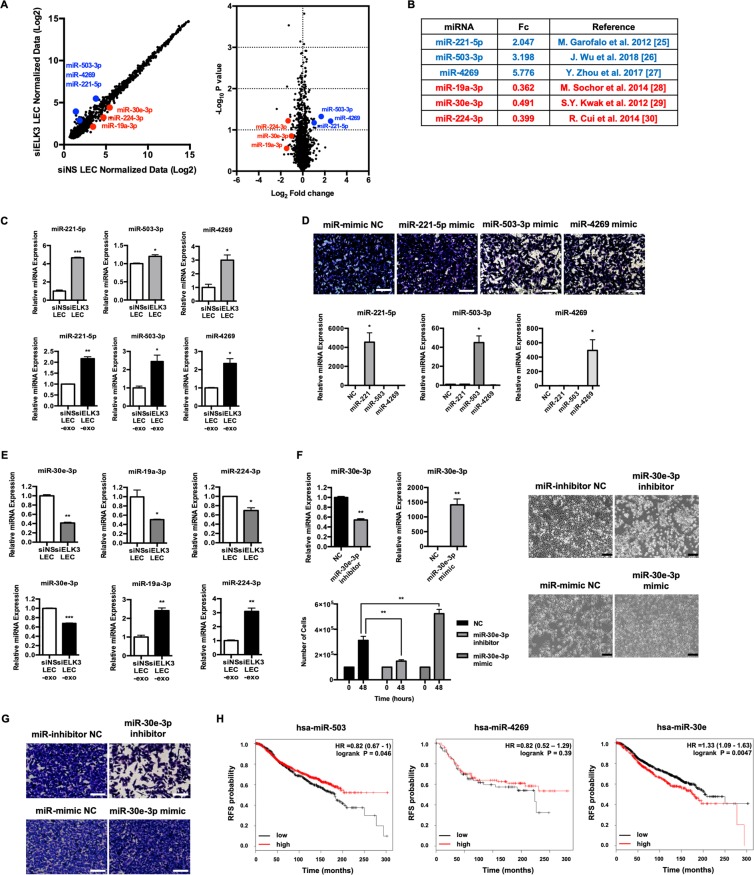
Figure 5.
ELK3 determines the miRNA contents of exosomes derived from LECs. (A) miRNA expression comparison between siNS LECs and siELK3 LECs. (Left) Scatter plot of the miRNA microarray analysis. The axes of scatter plot are normalized data from the samples. (Right) Volcano plot representing the p-values (Y axis) for the observed differences in miRNA expression (X axis). Three representative upregulated miRNAs were labeled in blue, and 3 representative downregulated miRNAs were labeled in red. (B) The analyzed representative miRNAs, fold changes from the miRNA microarray results and miRNA status as a tumor suppressor miRNA or onco-miRNA. (C) The intracellular and exosomal levels of 3 miRNAs that were selected as candidate antioncogenic miRNAs were analyzed by qRT-PCR. (D) Transwell assay of MDA-MB-231 cells that were transfected with the indicated miRNA mimics (Upper). The expression level of each miRNA was analyzed by qRT-PCR (Lower). Scale bar represents 100 μm. (E) The intracellular and exosomal levels of 3 miRNAs selected as candidate pro-oncogenic miRNAs were analyzed by qRT-PCR. (F) The effect of miR-30e-3p mimic or miR-30e-3p inhibitor on the proliferation of MDA-MB-231. The expression level of miR-30e-3p for each treatment was analyzed by qRT-PCR and the effect of each miRNA on the cell proliferation was assessed by cell counting at the indicated time (Left). Cell morphology was visualized via light microscopy at 48 h after transfection of each miRNAs (Right). Scale bar represents 200 μm. (G) Transwell assay of MDA-MB-231 cells that were transfected with the miR-30e-3p mimic or miR-30e-3p inhibitor. Scale bar represents 100 μm. (H) Kaplan-Meier plots for miR-503, miR-4269 and miR-30e. The plots for miR-503 and miR-30e were analyzed with all subtypes of breast cancer patients from the METABRIC dataset, and the plot for miR-4269 was analyzed with triple-negative breast cancer patients from the METABRIC dataset. Error bars represent the standard error from three independent experiments, and each experiment was performed using triplicate samples. *P < 0.05, **P < 0.01 ***P < 0.001 and ****P < 0.0001 (Student’s t-test).

