
Figure 5.
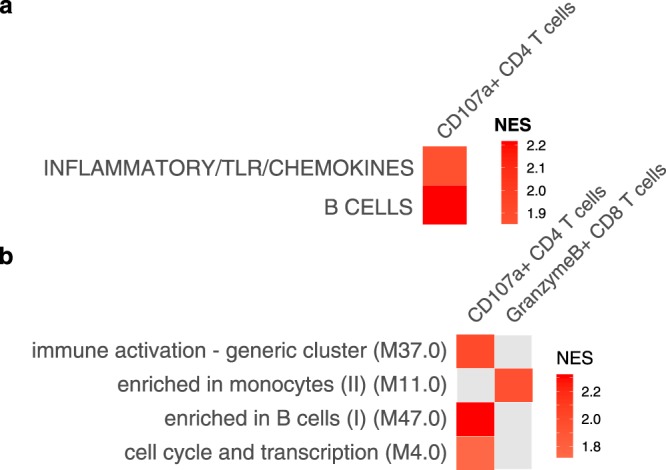
Gene set enrichment analysis of correlations between gene expression and later adaptive immune responses using (a) high-level and (b) low-level blood transcription modules. Expression values for each of 20,525 genes at I1 Day +27/I2 Day −1 (see Fig. S1) were correlated with the percentage of CD107a + CD4+ T cells or CD8+ T cells producing granzyme B after re-stimulation with P. falciparum-infected erythrocytes. Re-stimulated cells were PBMCs obtained a day before challenge (CHMI Day −1). Enrichment analysis were performed on correlations with P < 0.05 and ranked by Spearman rho. Only modules with Benjamini-Hochberg adjusted P values < 0.05 are shown. NES = normalized enrichment score.