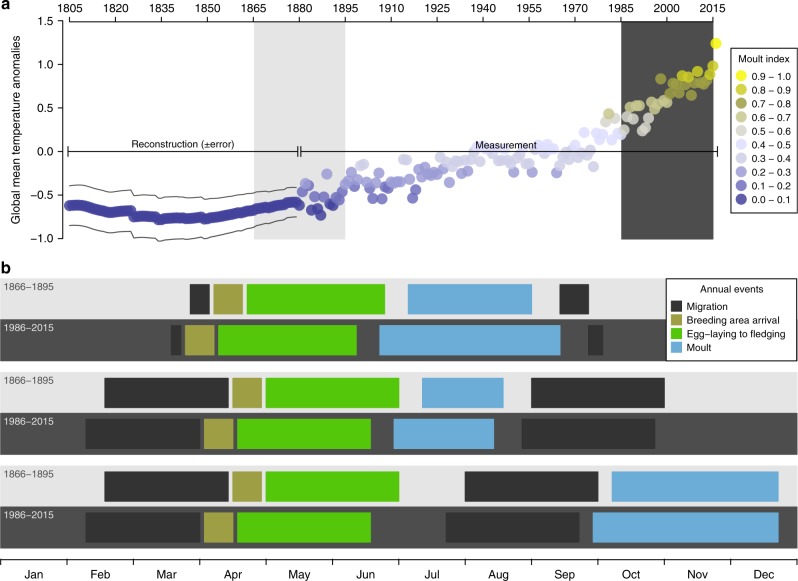
Fig. 2.
Passerine moult extent and phenological changes associated with global warming. a Global mean temperature anomalies (GMTA) trend since 1805 and bird feather moult extent. The moult index represents the relative extent of moult that was found in the study, averaged per year among all study species, such that the lowest relative extent of moult = 0 and the highest relative extent of moult = 1. Light grey and dark grey shaded areas represent two periods that are referred to in b. b Phenological changes in avian annual routine events over the last two centuries. Upper two rows (light grey = earlier years, dark grey = recent years): residents and short-distance migratory species – advancement of spring arrival and breeding, delayed autumn migration and shortened migration distance causing a longer moulting period and resulting in a more extensive moult. Middle two rows: Long-distance migratory species with pre-migration moult – advancement of spring arrival and breeding causing a longer moulting period, also resulting in a more extensive moult. Lower two rows: Long-distance migratory species with post-migration moulting period – it is suggested that advancement of the autumn migration combined with earlier arrival to the wintering areas and richer food resources in the northern Afrotropical Sahel zone after the summer rains allow these birds to moult more extensively. The changes in the timing of annual routine events are largely based on data from different published studies3–5,15,22

