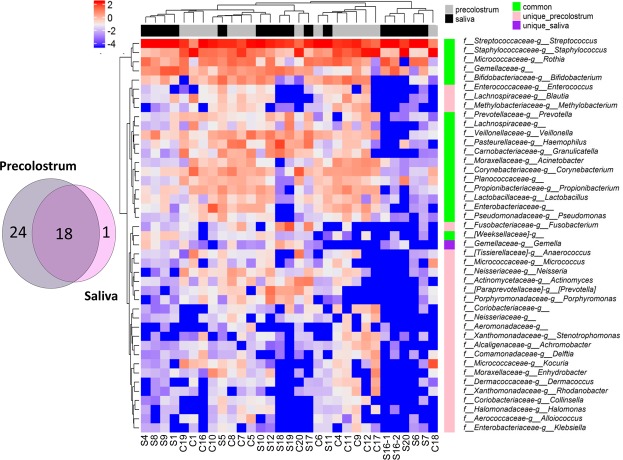
Figure 3.
(A) Venn Diagram representing the overlap between the infant oral and the maternal precolostrum core microbiotas estimated at genus level. Core microbiotas were defined as taxa present at a relative abundance above 1% in at least 50% of the samples of the corresponding group. (B) Heatmap representing log2 relative abundances of the 43 genus comprising both precolostrum and infant oral core microbiotas. Samples and taxa clustering were performed on Euclidean distances using complete linkage.

