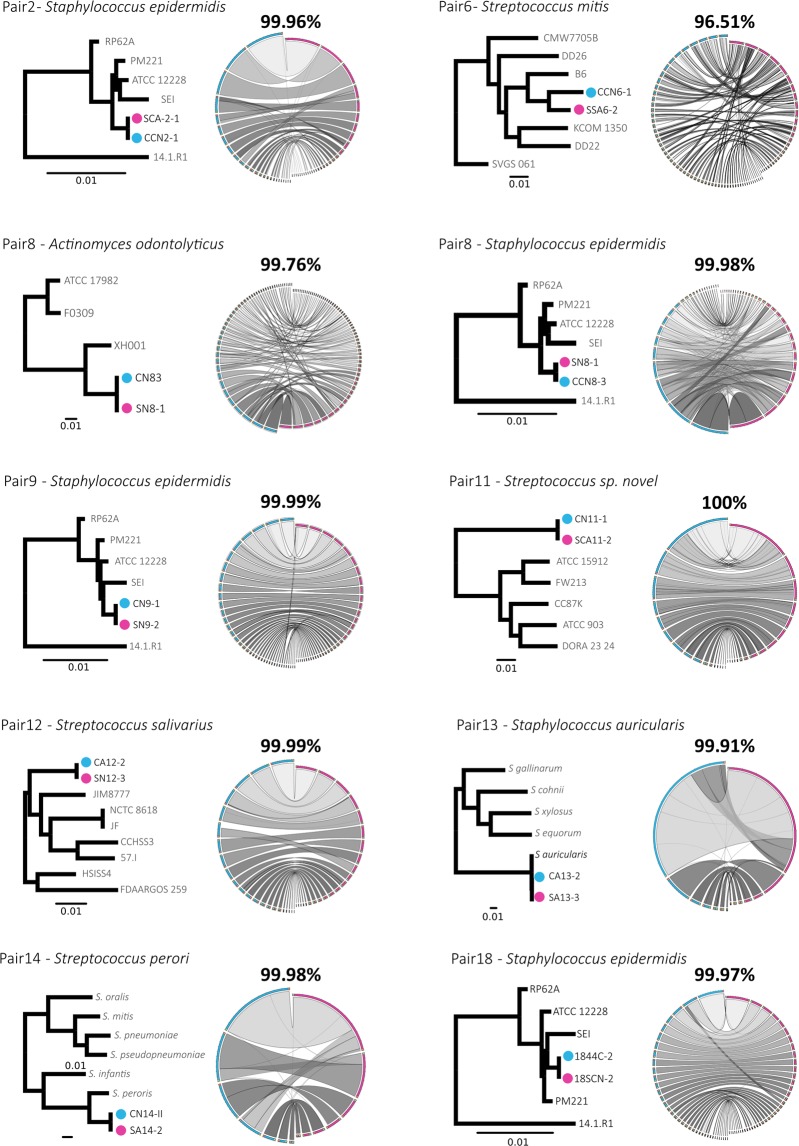
Figure 5.
Whole genome sequencing comparison of mother-infant paired isolates. The genomes of each pair of isolates and 3–6 additional available genomes of the same species were compared by a phylogenomic tree constructed based on all shared genes. The blue and red dots indicate isolates from the precolostrum and oral samples of the baby, respectively. The average values of similarity (average nucleotide identity values) of the genomes for each mother-child pair are shown. Sinteny (conservation in gene order) is shown by lines that join the same fragments.

