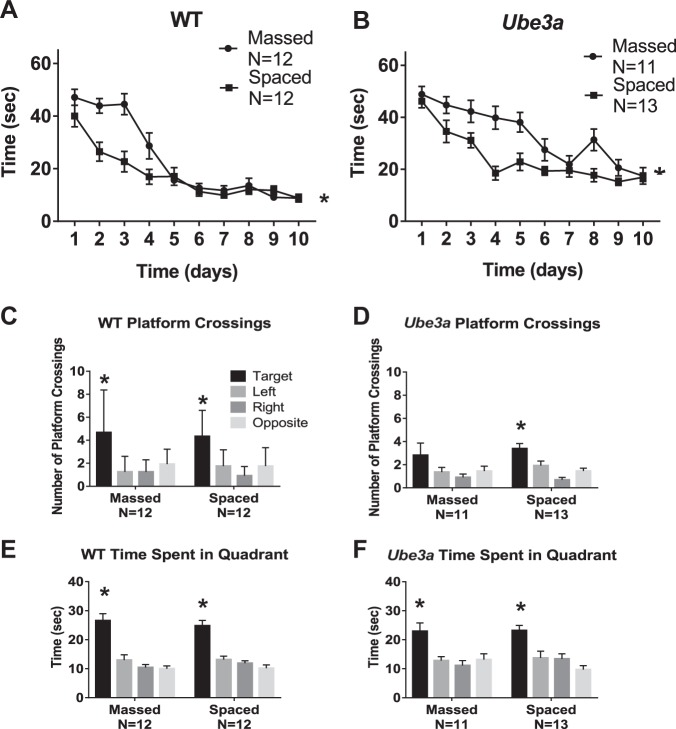
Fig. 5. Morris water maze performance in WT and Ube3a mice.
Ube3a displayed impaired spatial learning, which was improved by training with distributed trials spaced at 1 h intervals. a WT successfully achieved the acquisition criterion of 15 s or less to reach the hidden platform location. A significant difference was detected in the time course for acquisition by WT mice trained with massed versus spaced trials (F1,22 = 8.47, *p < 0.01), indicating faster learning in WT trained with spaced trials. A significant effect of training day was detected in WT (F9,198 = 49.3, p < 0.001), indicating learning across days as expected. A significant interaction between massed versus spaced x training day was detected in WT, (F9,198 = 5.62, p < 0.001). b Ube3a did not achieve the acquisition criterion of 15 s or less to reach the hidden platform location. A significant difference was detected in the time course for acquisition by Ube3a mice trained with massed versus spaced trials (F1,22 = 15.8, *p < 0.001), indicating faster learning with spaced training trials. A significant effect of training day was detected (F9,198 = 24.6, p < 0.01), indicating some learning across training days. A significant interaction between massed versus spaced x training day was detected in Ube3a (F9,198 = 2.65, p < 0.01). Three-way ANOVA detected significance for latency (F1,9 = 68.9, p < 0.001, latency x training condition: F1,9 = 5.16, p < 0.001, latency x genotype x training condition: F1,9 = 2.74, p < 0.01). c–e Probe trial performance 24 h after the last training trial. c WT crossed the previously trained target platform location significantly more times than over the corresponding left, right, and opposite locations, in both the massed and spaced training conditions (massed: F3,44 = 6.92, *p < 0.001; Dunnett’s multiple comparisons adjusted p values: target vs. left p < 0.001, target vs. right p < 0.001, target vs. opposite p < 0.01; spaced: F3,44 = 10.2, *p < 0.001, Dunnett’s multiple comparisons adjusted p values: target vs. left p < 0.001, target vs. right p < 0.001, target vs. opposite p < 0.001. d Ube3a crossed the previously trained target platform location significantly more than the left, right, and opposite corresponding platform locations after spaced training trials, but not after massed training trials (massed: F4,42 = 1.69, NS; spaced: F3,48 = 11.1, *p < 0.001; target vs. left p < 0.01, target vs. right p < 0.001, target vs. opposite p < 0.001). e WT spent significantly more time in the previously trained target quadrant than in the left, right, and opposite quadrants, for both massed versus spaced (massed: F3,44 = 22.3, *p < 0.001; target vs. left p < 0.001, target vs. right p < 0.001, target vs. opposite p < 0.001; spaced: F3,44 = 26.4, *p < 0.001; target vs. left p < 0.001, target vs. right p < 0.001, target vs. opposite p < 0.001). f Ube3a spent significantly more time in the previously trained target quadrant than in the left, right, and opposite quadrants, for both massed versus spaced (massed: F3,40 = 6.73, *p < 0.001; target vs. left p < 0.01, target vs. right p < 0.001, target vs. opposite p < 0.01; spaced: F3,48 = 9.74, *p < 0.001; target vs. left p < 0.01, target vs. right p < 0.01, target vs. opposite p < 0.001)

