Fig. 1.

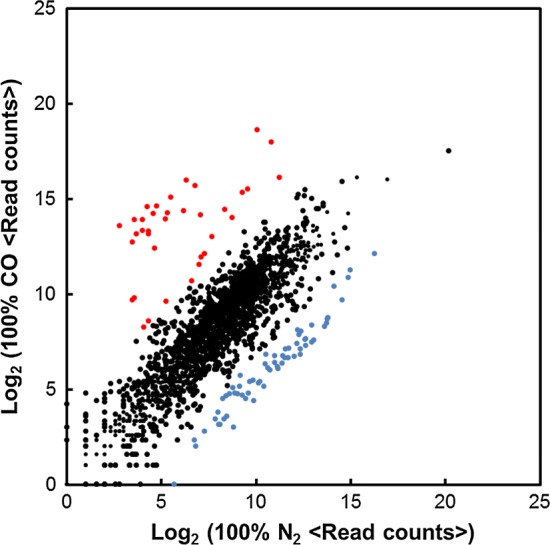
Comparison of read counts between C. pertinax grown under 100% CO and 100% N2. Each plot shows an open-reading frame. Red plots, upregulated DEGs; blue plot, downregulated DEGs; black, unchanged genes

Comparison of read counts between C. pertinax grown under 100% CO and 100% N2. Each plot shows an open-reading frame. Red plots, upregulated DEGs; blue plot, downregulated DEGs; black, unchanged genes