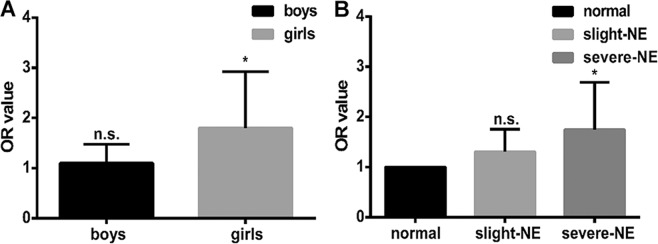
Figure 2.
Sensitivity analysis in different genders and different NE severity. (A) Association of gender with NE through multivariable logistic regression after controlling for confounding factors including family structure, household income, and house size. The difference in OR between different genders was compared using an unpaired t-test, and the difference between the two subgroups was significant (P < 0.001). (B) Sensitivity analysis for different NE severity. Normal children were regarded as the reference group. The difference in OR between groups with different NE severity was compared by unpaired t-test, and there was statistical significance between the two subgroups (P < 0.001). n.s. not significant; *P < 0.05.

