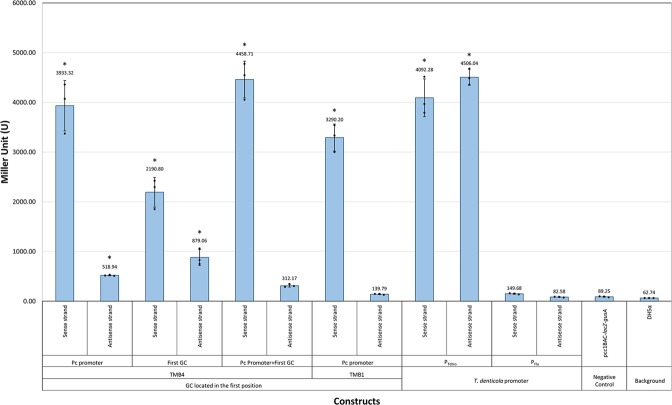
Figure 4.
The synergy effect between PC and the TMB4 ORF-less GC in the first position estimated by β-glucuronidase enzyme assays. Error bars indicate the standard errors of the means from three replicates. The scatter plots indicate the result from each replicate and the average Miller units for each construct were shown above the bars. The asterisks (*) indicate the constructs were statistically significantly different from the negative control group (pCC1BAC-lacZα-gusA) with the p-value < 0.05 by using ordinary one-way ANOVA followed by Dunnett’s multiple comparison tests.

