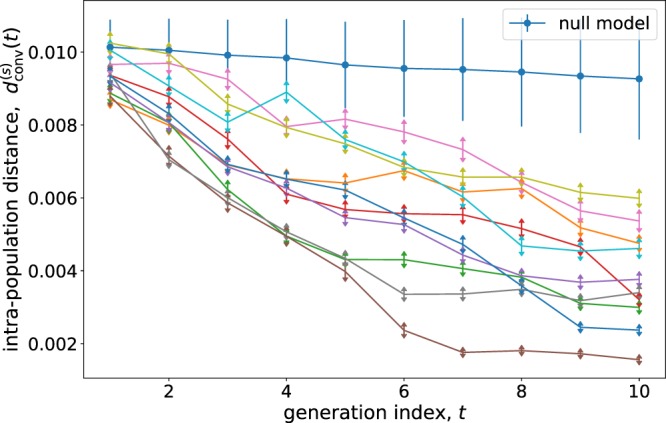
Figure 2.

Intra-population distance of the populations sculpted by different subjects (s) as a function of the generation (t). The Euclidean metrics in face space has been used (see Supplementary Sec. S4), although the results are qualitatively equal for other relevant metrics. Each curve corresponds to a different subject (for 10 randomly chosen subjects). The upper curve of joined circles corresponds to the null model genetic experiment, in which the left/right choices are random.
