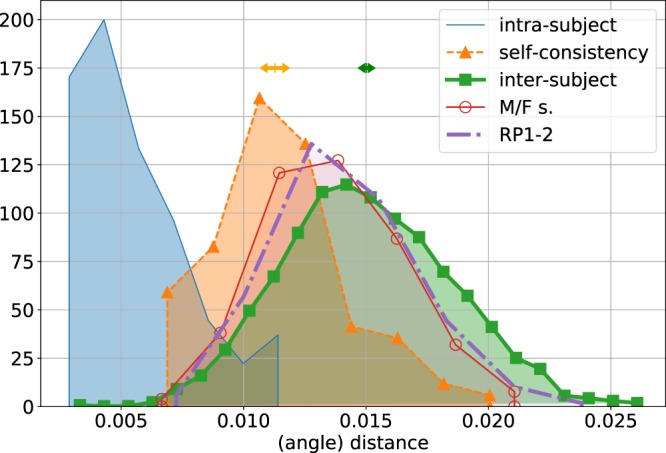
Figure 3.

Main panel: Normalised histograms of pseudo-distances. Blue: subject intra-population distances, or self-distances of all the populations sculpted in E1. Orange: self-consistency distances, or distances among couples of populations sculpted by the same subject in E2. Green: inter-subject distances, or distances among couples of populations sculpted by different subjects in E1. Purple: distances among couples of populations sculpted by different subjects in different experiments, E1 and E3 (differing in the reference portrait). Red: distances among couples of populations sculpted by subjects of different gender in E1. The orange and green arrowed segments over the self-consistency and inter-subject histograms indicate the confidence intervals of the histogram averages, and respectively, with nsc = Sscm(m − 1)/2 and ni = S1(S1 − 1)/2.
