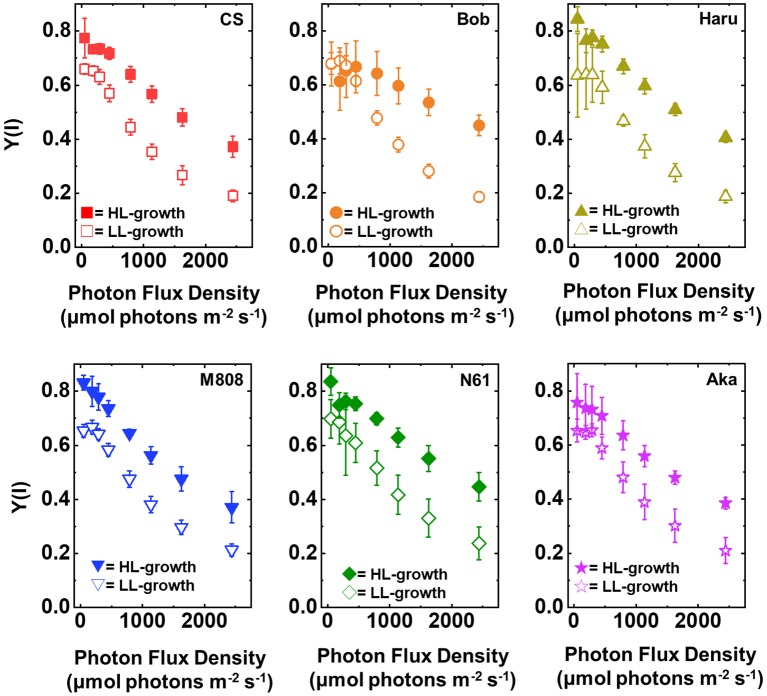
Figure 3.
The response of Y(I) to light intensity in six wheat cultivars grown under LL (open symbol) and HL (closed symbol) conditions. The measurement was conducted under atmospheric conditions (21 kPa O2, 40 Pa CO2) at 25°C. Data were expressed as mean ± SD of three to five independent experiments. Red squares indicate the results of CS, orange circles indicate the results of Bob, dark yellow triangles indicate the results of Haru, blue inverted-triangles indicate the results of M808, green diamonds indicate the results of N61, and purple stars indicate the results of Aka.

