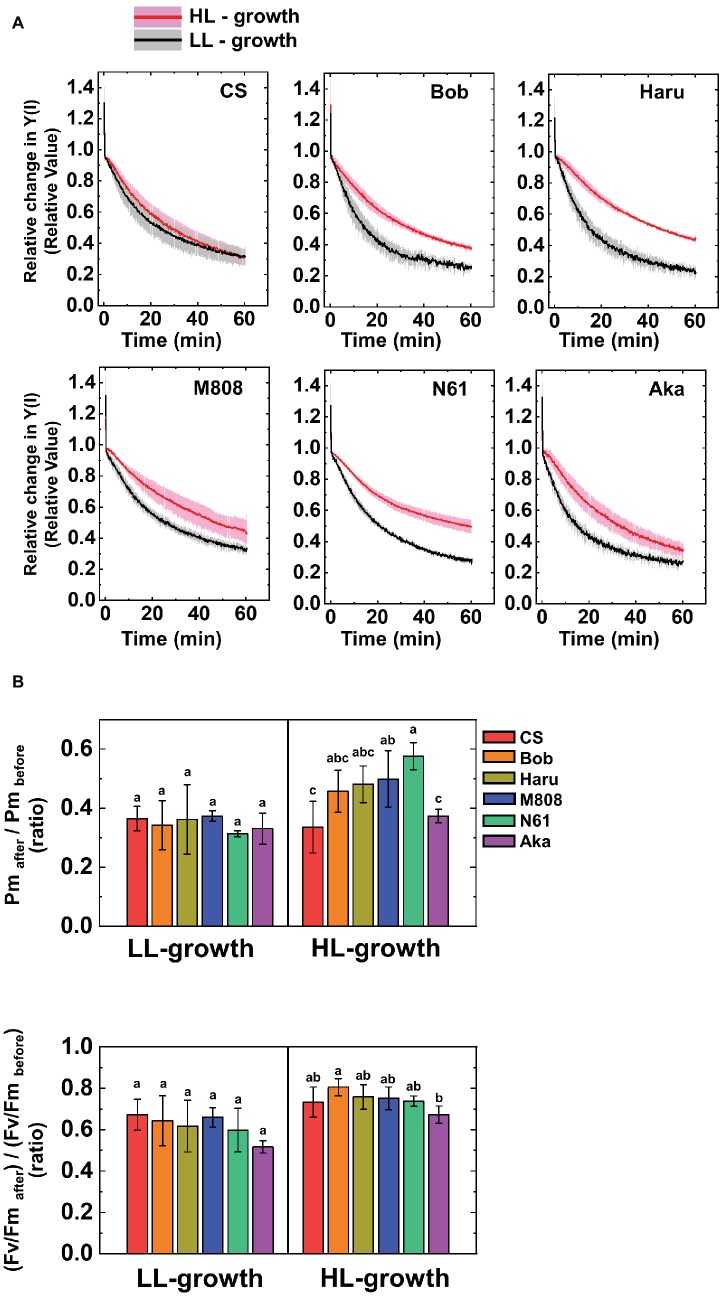
Figure 6.
The susceptibility of PSI photoinhibition to repetitive short-pulse (rSP) illumination in wheat cultivars grown under LL and HL conditions. (A) Time-course analysis of the relative change in Y(I) during rSP illumination under atmospheric conditions (21 kPa O2, 40 Pa CO2) at 25°C. Before rSP illumination, wheat plants were adapted in the dark for at least 1 h. Wheat leaves were illuminated every 10 s with a saturating pulse (300 ms, 20,000 μE m−2 s−1) for 1 h in the dark. Data were expressed as mean ± SD of three to five independent experiments. Black line indicates the mean result of LL-grown wheat cultivars and gray shadow indicates the SD of the results of the LL-grown wheat cultivars. Red line indicates the mean results of the LL-grown wheat cultivars and pink shadow indicates the SD of the results of the HL-grown wheat cultivars. The change in Fv/Fm and Pm between before and after rSP illumination are shown in (B). After rSP illumination, wheat cultivars were kept in the dark for 30 min, and Fv/Fm and Pm were measured. Data were normalized to the Fv/Fm and Pm before rSP illumination. Data were expressed as mean ± SD of three to five independent experiments. Different letters above the bars indicate a significant difference between those wheat cultivars (ANOVA and Tukey-Kramer HSD test, p < 0.05). Red bars indicate the results of CS, orange bars indicate the results of Bob, dark yellow bars indicate the results of Haru, blue bars indicate the results of M808, green bars indicate the results of N61, and purple bars indicate the results of Aka.

