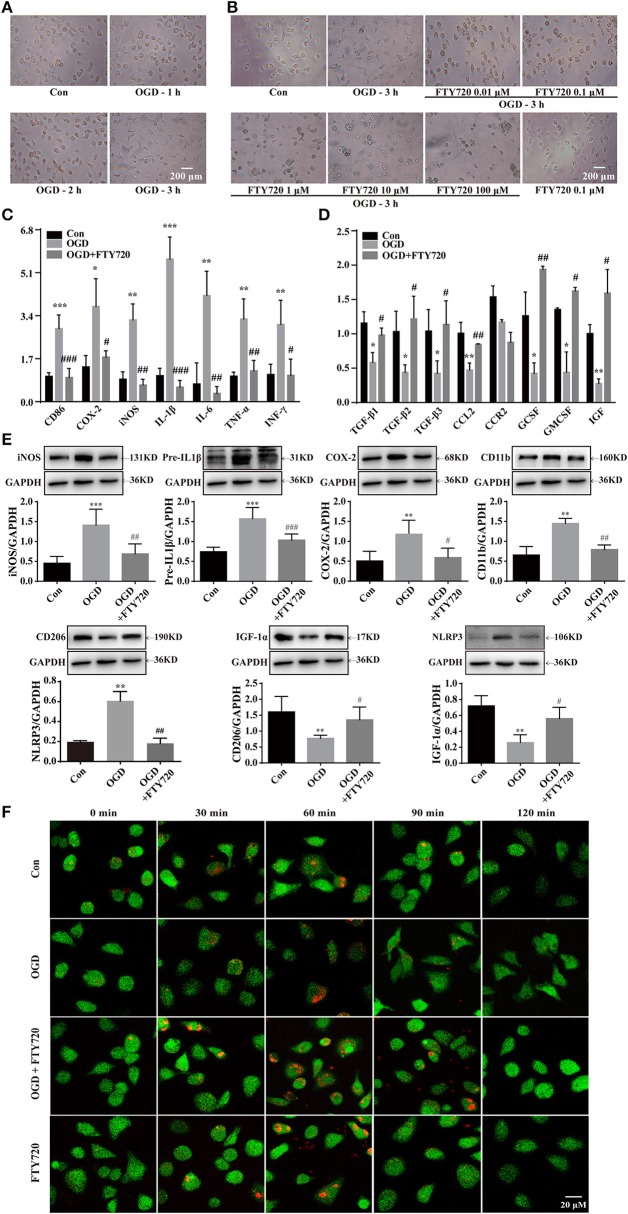
Figure 3.
FTY720 treatment promotes microglial phenotypic change from M1 to M2 in OGD model. OGD for 3 h induced microglial cells activation which showed larger and rounder shape with slim branches compared with the control group (A). FTY720 (0.01 μM) suppressed the amoeboid “activated” morphology of microglia induced by3 h OGD (B). FTY720 reversed 3 h OGD-induced mRNA expressions of M1 markers (CD86, COX-2, iNOS, IFN-γ, IL-1β, TNF-a, and IL-6) (C) and mRNA expressions of M2 markers (CCL2, GCSF, GMCSF, IGF-1, TGF-β1, TGF-β2, and TGF-β3) (D) in microglial cells. In addition, FTY720also reversed 3 h OGD-induced protein expressions of NLRP3 inflammasome and M1 markers (CD11b, COX-2, iNOS andIL-1β) and protein expressions of M2 markers (CD206 and IGF-1a) in microglial cells (E). n ≥ 4 per group, *p < 0.05, **p < 0.01, ***p < 0.001, compared to the Con group; #p < 0.05, ##p < 0.01, ###p < 0.001, compared to the OGD group, by one-way ANOVA and Tukey's test. pHrodo™ Green Zymosan BioParticles were added to the cells and imaged after 30, 60, 90, and 120 min. The green staining in the microglia cells was due to Cell Tracker™ Green. (F) The microglia cells showed the time course of red fluorescence increased, documenting the accumulation of pHrodo-conjugated zymosan bioparticles (1 μm in diameter) in the intracellular acidic environment corresponding to phagosomes. All data are presented as means ± SEM.

