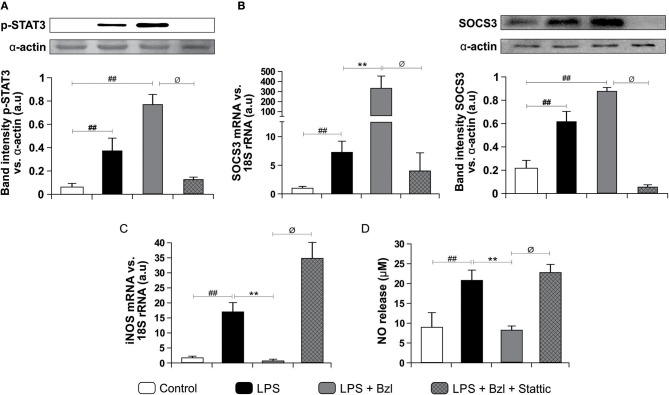
Figure 2.
Cardiomyocytes were treated with 10 μM Stattic, a specific inhibitor of STAT3, 30 min before the addition of 15 μM benznidazole (Bzl). Cells were stimulated with 10 mg/L LPS 30 min after Bzl treatment. After 15 min, p-STAT expression was determined by Western blot with a specific antibody and normalized against α-actin (A). After 24 h, SOCS3 mRNA levels were analyzed by RT-qPCR and normalized against 18S rRNA. After 48 h SOCS3 protein expression was determined by Western blot with a specific antibody and normalized against α-actin (B). After 48 h, iNOS mRNA levels were analyzed by RT-qPCR and normalized against 18S rRNA (C), and NO levels were quantified by the Griess reaction in culture supernatants (D). Results are expressed as the mean of three independent experiments (n = 3, 5 replicates/treatment) ± SEM. White bar: Unstimulated control cells. Black bar: LPS stimulated cells. Gray bar: LPS stimulated and Bzl treated cells. Hatched gray bar: Stattic pre-treated, LPS stimulated and Bzl treated cells **P < 0.001, vs. LPS-stimulated cells; ##P < 0.001 vs. control cells.øP < 0.05 vs. Bzl-treated and LPS-stimulated cells.

