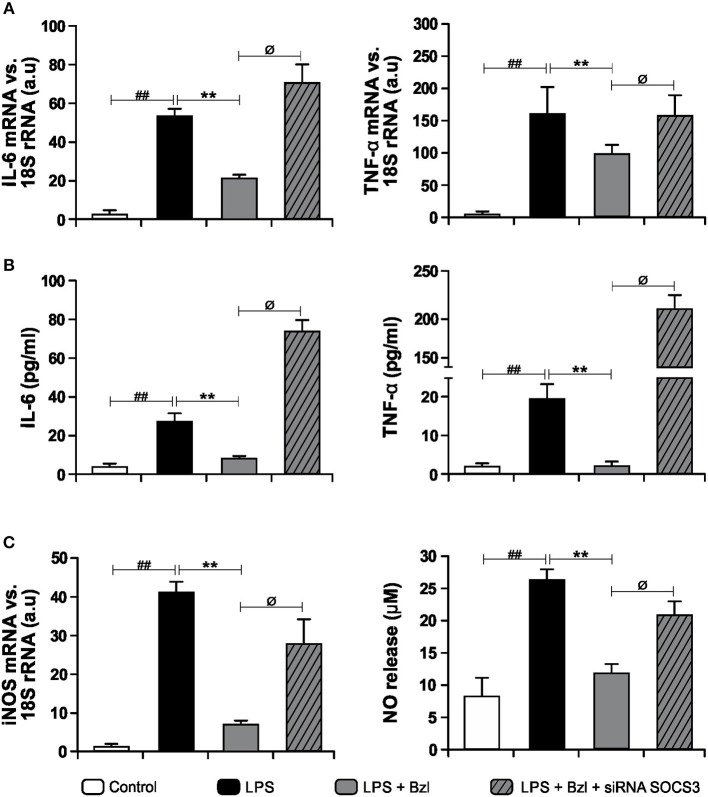
Figure 3.
Cardiomyocytes were transfected with SOCS3 siRNA. After 72 h, cells were treated with 15 μM benznidazole (Bzl) for 30 min and then with 10 mg/L LPS. After 4 h, IL-6 and TNF-α mRNA levels were analyzed by RT-qPCR and normalized against 18S rRNA (A). Concentration of cytokines in culture supernatants was measured by ELISA (B). After 48 h, iNOS mRNA levels were analyzed by RT-qPCR and normalized against 18S rRNA and NO levels were quantified by the Griess reaction in culture supernatants (C). Results are expressed as the mean of three independent experiments (n = 3, 5 replicates/treatment) ± SEM. White bar: Unstimulated control cells. Black bar: LPS stimulated cells. Gray bar: LPS-stimulated and Bzl-treated cells. Hatched gray bar: SOCS3 silenced, LPS-stimulated and Bzl-treated cells. **P < 0.001, vs. LPS-stimulated cells; ##P < 0.001 vs. control cells.øP < 0.05 vs. Bzl-treated and LPS-stimulated cells.

