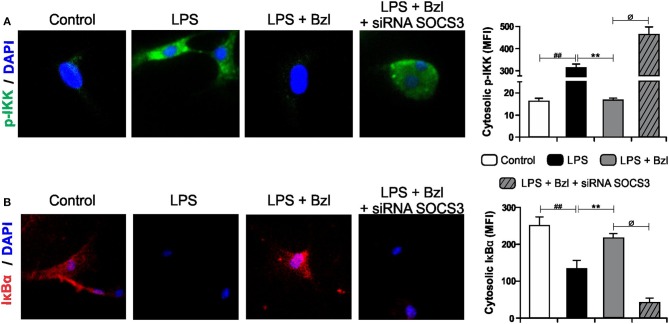
Figure 4.
Cardiomyocytes were transfected with SOCS3 siRNA. After 72 h, cells were treated with 15 μM of benznidazole (Bzl) for 30 min and then with 10 mg/L LPS. p-IKK (15 min) (A), and IκBα (30 min) (B) expression was detected by immunofluorescence with a rabbit polyclonal IgG anti- p-IKK or anti- IκBα (primary antibodies), and Goat anti-rabbit IgG Alexa Fluor 488 or Alexa Fluor 594 (secondary antibodies), respectively. Cell nuclei were stained with 300 nM DAPI. Representative microphotographs (400x) are shown. Mean fluorescence intensity (MFI) was quantified using Fiji Software, and the results are expressed as the mean of three independent experiments (n = 3, 5 replicates/treatment) ± SEM. White bar: Unstimulated control cells. Black bar: LPS-stimulated cells. Gray bar: LPS-stimulated and Bzl-treated cells. Hatched gray bar: SOCS3- silenced, LPS-stimulated and Bzl-treated cells. **P < 0.001, vs. LPS-stimulated cells; ##P < 0.001 vs. control cells.øP < 0.05 vs. Bzl-treated and LPS-stimulated cells.

