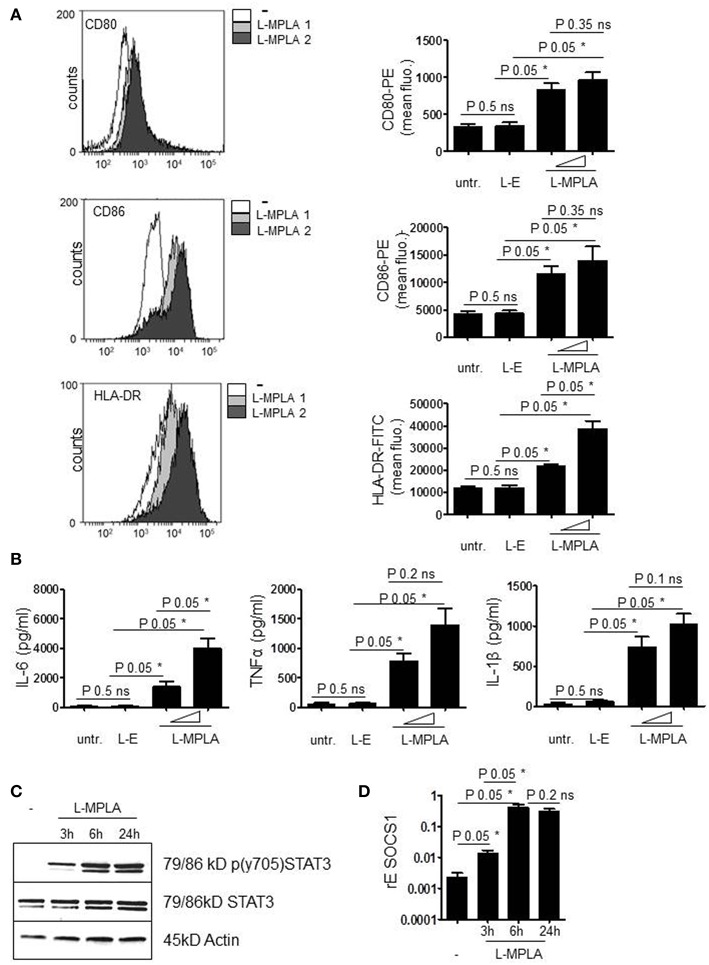
Figure 2.
(A) Purified cells were incubated with L-MPLA at a liposome/monocyte ratio of 25:1 or 75:1. After overnight incubation, monocytes were analyzed for activation markers (CD80/86) and HLA-DR expression with antibody staining and flow cytometry. Shown are histogram overlays (WEASEL flow cytometry software) (L-MPLA 1 = liposome/monocyte ratio 25:1 L-MPLA 2= 75:1) and the associated quantification of n = 3. Quantification includes cells incubated with liposomes generated without MPLA (L-E). Performed test: Kruskal-Wallis. Number of groups: 4; CD80: P-value 0.0378; sum value*; CD86: P-value 0.0378; sum value*; HLA-DR: P-value 0.0249; sum value* the medians vary signif. (P < 0.05). (B) Supernatant of cultures defined in (A) was used for ELISA analysis to detect IL-6, TNFα, and IL-1β. Kruskal-Wallis. Number of groups: 4; IL-6: P-value 0.0237; sum value*; TNF: P-value 0.030; sum value*; IL-1β: P-value 0.0261; sum value* the medians vary signif. (P < 0.05). (C) Monocytes, incubated with L-MPLA (liposome/monocyte ratio 75:1) for the indicated timepoints were lysed and applied for western blot analyses with anti-p (Tyr701) STAT3, anti-STAT3, and anti-β-Actin (loading control). Shown is one representative blot out of three experiments. (D) RNA of cells, treated as described in (C), was isolated and cDNA produced. mRNA induction was analyzed by qRT PCR using sequence specific Primer for SOCS1 and SYBR Green master mix. Results were normalized against housekeeping gene GAPDH. Kruskal-Wallis. Number of groups: 4; SOCS1: P-value 0.0216; sum value* the medians vary signif. (P < 0.05). A, B, D Columns are the mean of three different donors/experiments (n = 3) + standard deviation (std) as error bars. Shown p-values: The comparison of two data groups (line above the bars depicts the compared groups) were analyzed by Mann–Whitney U test, one-tailed, confidence intervals 95%, *p ≤ 0.05; ns, not significant.

