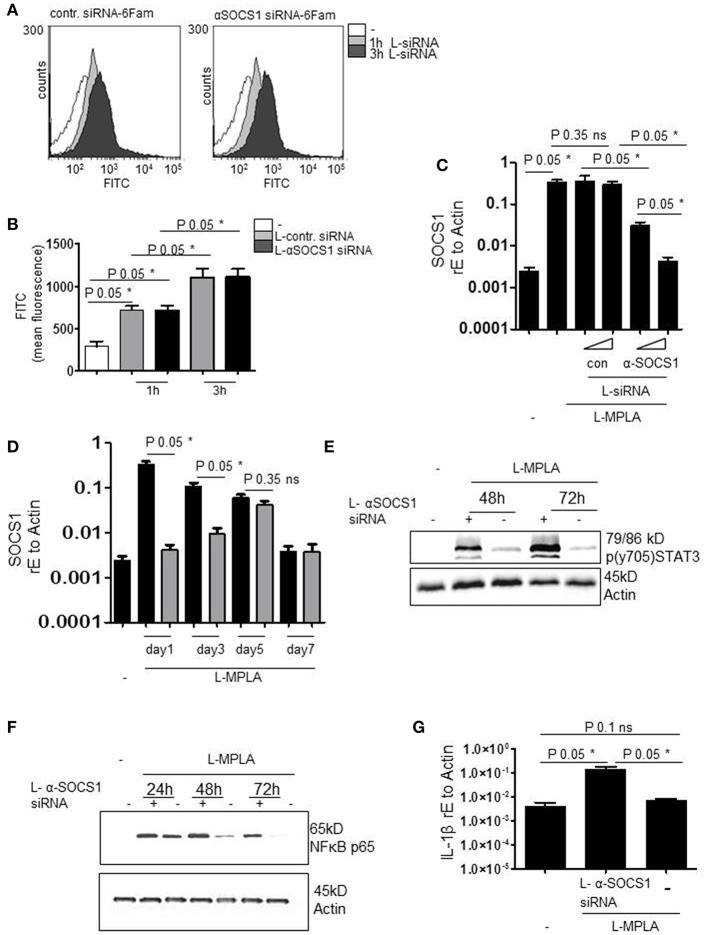
Figure 3.
(A) Primary human monocytes were incubated with coatsome (NOF Corporation)-packed siRNA-6Fam against SOCS-1 (L-αSOCS siRNA) or an unrelevant sequence (L-con siRNA) for 1h or 3h. Uptake of liposomes was detected by analyzing FITC signal by a FACSCanto. Shown is the overlay of FACS histogram produced with WEASEL flow cytometry software. (B) Quantification of (A) and two more experiments. Kruskal-Wallis: number of groups: 5; P-value 0.0162; sum value* the medians vary signif. (P < 0.05). (C) L-MPLA-activated cells, treated with increasing concentrations of L-αSOCS siRNA or L-con siRNA (50μl/ml, 100μl/ml L-siRNA) for 24 h, were lysed. RNA was isolated, cDNA produced and used for qRT PCR analyses of SOCS-1. Results were normalized against GAPDH values. Kruskal-Wallis: number of groups: 6; P-value 0.0119; sum value* the medians vary signif. (P < 0.05). (D) Cells were stimulated with MPLA and treated for the indicated timepoints with L-αSOCS siRNA (100μl/ml L-siRNA). RT PCR with SOCS1-specific Primers was performed. Kruskal-Wallis: number of groups: 9; P-value 0.0038; sum value** the medians vary signif. (P < 0.05). (E,F) Cells were cultured for the indicated timepoints with L-MPLA ± L-αSOCS1 siRNA, before lysing. Western blot analyses was performed with (E) p (y704) STAT3 (F) anti-p56 and anti-Actin (loading control)-specific antibodies. (G) Monocytes were treated as described in (E) for 72 h, RNA was isolated, cDNA produced and used for rtPCRs with IL-1β specific primers. Data were normalized against Actin. Kruskal-Wallis: number of groups: 3; P-value 0.0390; sum value* the medians vary signif. (P < 0.05). In (B,C,F) is the mean + std, n = 3 shown. Statistics: The comparison of two data groups (line above the bars depicts the compared groups) were analyzed by Mann–Whitney U test, one-tailed, confidence intervals 95%, *p ≤ 0.05; ns, not significant.

