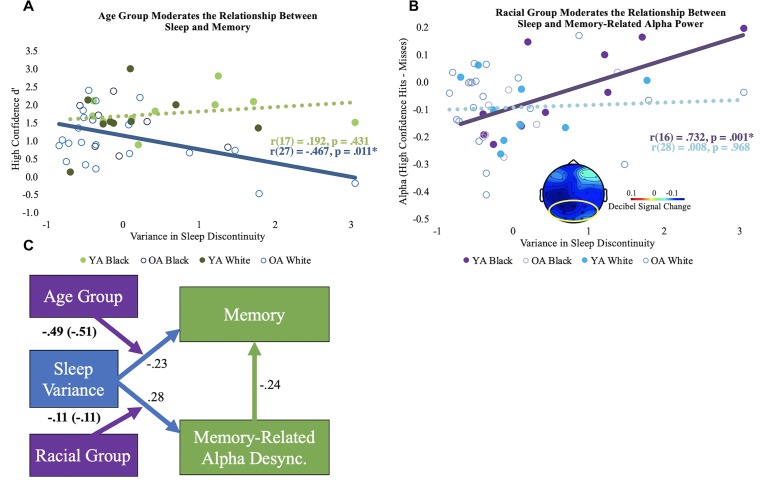
FIGURE 2.
Moderation results. (A) Bivariate correlations (unadjusted) for the variance in sleep discontinuity and high confidence d’ by age group. The significant correlation is shown using a solid line, and the non-significant correlation is shown using a dotted line. (B) Bivariate correlations (unadjusted) for the variance in sleep discontinuity and alpha desynchronization (high confidence hits minus misses) by racial group. The mean alpha desynchronization effect in the posterior electrode cluster (outlined in yellow; 440 to 1360 ms) is shown in bottom center of the plot. Each participant’s alpha power mean is shown. Significance is illustrated the same as in panel (A). (C) Conceptual model of the moderation results. The direct paths for sleep discontinuity are shown in blue. The direct path for the correlation coefficient for memory-related alpha desynchronization and memory performance is depicted in green. Direct paths reflect the correlations across age and racial groups and are adjusted for chronological age. The moderator variables are shown in purple, and the age-adjusted interaction coefficients are displayed. Interaction coefficients that are not adjusted for age are in parentheses. Boldface indicates significant statistics. Desync = desynchronization.

