Figure 3.
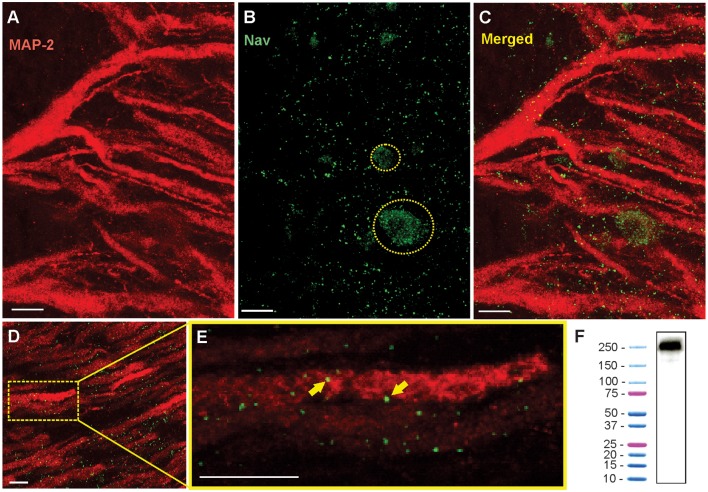
Immunohistochemistry shows the punctate expression of Nav channels on the apical dendrites. (A) Confocal image of a 16 μm section of ELL showing the red Anti-MAP2 labeled apical dendrites projecting through tSF and VML. White scale bars are 10 μm in all panels. (B) Nav channel punctate distribution (green dots). Nav label was also found on the surface membranes of interneurons (e.g., VML cells) where their distribution is more uniform. Two interneuron cell bodies are outlined with a dashed yellow line. (C) Merged MAP2 and Nav labeling. Note that these images show the combined z-layers of the scan through the 16 μm slice but that looking through the individual successive scans at varying depth (0.5 μm apart) can help determine the proximity between MAP2 and Nav labeling. (D) Nav and MAP2 labeling in a more distal portion of VML (~200 μm from tSF boundary). (E) Enlarged view of one dendrite in the image displayed in (D) selected for quantification of Nav channels. The proximity between the labeled Nav channels and the labeled MAP2 inside dendrites allows us to confirm that the channels were in the membrane of a PC dendrite. Two puncta are indicated with yellow arrows. Note that the Nav and MAP2 labeling does not need to overlap directly since MAP2 is located inside the dendrite and Nav channels are in the membrane. We thus expect some of the puncta to be slightly separated (in the x-y plane or the z plane) from the MAP2 labeling. (F) Western blot analysis of brain tissue demonstrating the specificity of Anti-pan Nav antibody. The western blot of the tissue processed along with a protein ladder displayed a single band at ~250–260 kDa.

