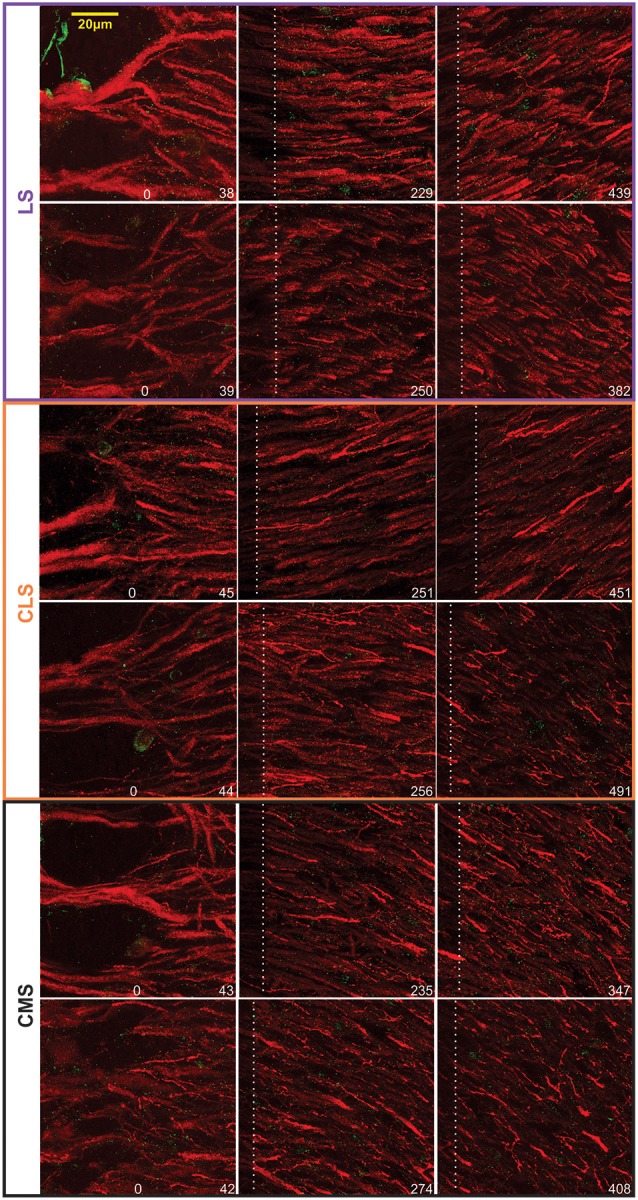
Figure 4.

Examples of Nav-Map 2 expression in the ELL. Confocal images from two brains (top vs. bottom rows for each map) taken at different distances from the tSF. The location of the distal edge of the image is specified in μm at the bottom right of each image. The white dashed lines indicate the edge of the previous—overlapping—scan and thus the pixels on the left of this line are bleached from the previous scan.
