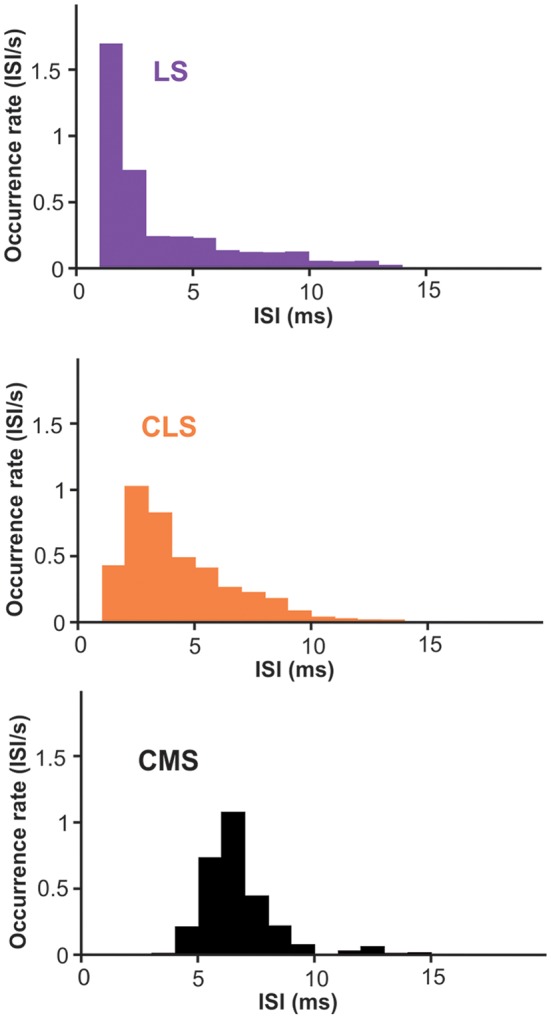
Figure 7.

Inter-spike intervals (ISIs) histogram for burst-spikes during spontaneous activity. Burst of spikes was identified as described in the methods and the interval between the spikes in each burst contributed to the histograms displayed. The average interval is shorter in LS than CMS with significant differences across all three segments (averages ± SE: LS = 3.2 ± 0.6; CLS = 3.8 ± 0.5; CMS = 6.2 ± 0.3. Wilcoxon test: LS-CLS, p < 0.0001; LS-CMS, p < 10−9; CLS-CMS, p < 10−7. n = 13–19 neurons).
